Macro Implications, As Silver Takes Leadership From Gold

Since we noted the initial move to break the 200 day moving average – and at least temporarily break the downtrend on August 27th – the Silver/Gold ratio (SLV/GLD) has held its breakout, looking to close the week and the month of August on a signal that we have long anticipated.

silver gold ratio

Okay, but the monthly chart of the Silver/Gold ratio makes abundantly clear that nothing has happened that has not happened before during the precious metals bear market. So that is the caveat to a macro thesis that would see a change to inflationary (as led by Silver/Gold), thereby letting commodities of all stripes and many global markets out of the barn. The monthly EMA 30 (grey dotted line) is a reasonable marker for the ratio’s post-2011 containment. The ratio’s price is below that marker. Continue reading "Macro Implications, As Silver Takes Leadership From Gold"

Bitcoin Is Running Out Of Time

Last month I updated the Bitcoin chart after this cryptocurrency made a buzz at the end of the June pushing through $13,000. In the same post, I shared with you the 4-hour chart where the horizontal consolidation had been spotted. The Bitcoin price was at the $11,500 level then, and I expected it to drop lower to complete the correction.

Let’s see below what you were waiting for Bitcoin then.

Bitcoin Poll

The majority of you expected Bitcoin to drop to the $7,800. Bitcoin haters were second to see head much lower. And the fans were in the third place with an immediate reversal option (stops here).

So far the least liked option of CD=AB at the $8,980 was the most accurate prediction as the Bitcoin indeed dropped lower but only to the $9,071. I think that time emotions were above the calm mind as the 5-digit price tag of the crypto spurred both euphoria and hatred as opinions were divided. Continue reading "Bitcoin Is Running Out Of Time"

Gold Hit First Target

Last Wednesday gold had hit the minimum target of $1490 that we were waiting for since January when the price was at $1288. The target was clear, but the path was not and only this May the market eliminated one of three possible options. One month later, it has finally shown its real face leaving the single initial path to go.

Last month gold advanced quite well, but it failed ahead of the first target. I spotted the consolidation on the 4-hour chart and shared it with you to reassure disappointed bullish traders as to when the price doesn’t reach the target someone could start to exit early. Consolidations are tricky by nature, and I showed you three possible types it could unfold. Let’s see below which one you liked the most.

Gold Poll

The triangular type was your first choice; the simple correction was the second with a minor gap, and the complex flat was the least liked. And again the majority of you were right as this was a triangle. Let’s see it in the updated 4-hourly chart below. Continue reading "Gold Hit First Target"

Fed Set To Rattle Global Markets

Today is the day for the US Fed to announce their rate decision and we believe the 25 basis point rate cut is the only option they have at the moment that will attempt to settle foreign market fears and allow for a suitable “unwinding” of the credit/debt “setup” we highlighted in Part I of this research post.

We believe out August 19 expectation of a global market PEAK and the beginning of a price reversion move is related to multiple aspects of the timing of this Fed move and the current global economic outlook. The unwinding of this debt/credit bubble will likely take many more years to unravel. Yet, right now the US Fed is trapped in a scenario they never expected to find themselves in. Either continue to run policy that supports the US economy (where rates would likely stay between 1.75 to 2.75) over the next 5+ years or yield to the global market and attempt to address a proper exit capability for this debt/credit “setup”.

We believe global investors are expecting a massive collapse in the US stock market as a reaction to this move by the Fed and because of the expectation that another bubble has set up in the US. But we believe the actual bubble is set up in the foreign markets and not so much in the US. Yes, the US markets have extended to near all-time highs and the US consumer is running somewhat lean. It would be natural for the US economy to revert to lower price levels and for the US economy to rotate as “price exploration” attempts to find true market support. Yet, our fear is that the foreign markets are much more fragile than anyone understands at the moment and that a reversion in the US markets will prompt a potential collapse in certain foreign markets.
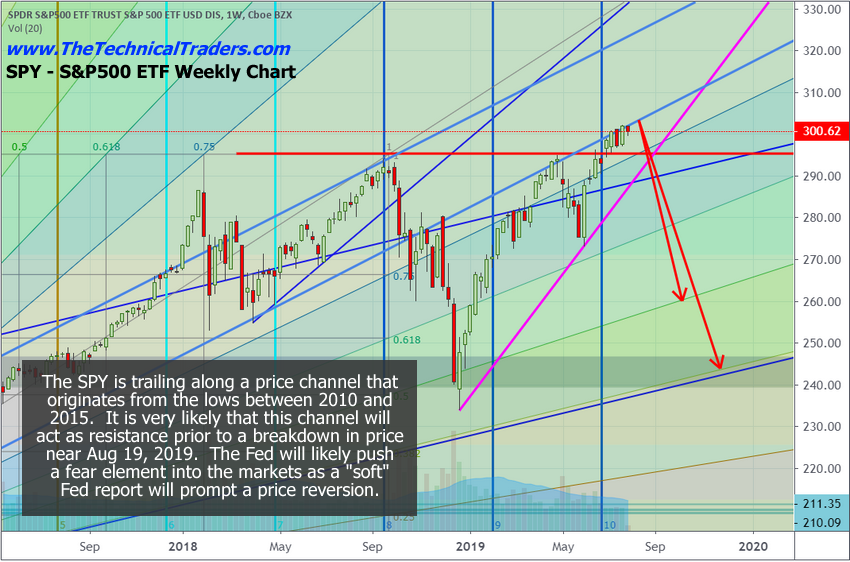
Weekly SPY Chart

This Weekly SPY chart highlights what we expect to transpire over the next 6 to 8+ months. We believe the August 19 peak date that we predicted months ago will likely start a process that will be tied to the US election cycle event (2020) and the US Fed in combination with global market events. We believe a reversion price process is about to unfold that could be prompted into action over the next 2+ weeks by the US Fed, trade issues and global central banks.

fed

If the US Fed drops the FFR by 25pb, the fragility of the foreign market debt/credit issues is not really abated or resolved. It just allows for a bit of breathing room that may allow these foreign debtors enough room to wiggle out of some of their problems. The US Fed would have to decrease rates by at least 75 basis point before any real relief will materialize for these foreign debtors. Continue reading "Fed Set To Rattle Global Markets"

Pre-Fed Precious Metals Update

We review these metals as the media schleps all over itself trying to tell people why the Fed will cut 1/4, will cut 1/2, should not cut at all and/or why the president of these United States of America is on Twitter haranguing the Fed to be as disreputable as Mario Draghi and China’s central planners because they know how to play the game. It’s all a game after all, isn’t it Trump? You old currency warrior, you.

Copper daily is nesting on the SMA 50 but locked below resistance and the SMA 200. Still in bounce mode but very unspectacular.

copper

Copper weekly still looks pretty gross. It’s above critical support but locked below a ton of resistance. The 2016-2019 pattern also looks like a freak. I refuse to like industrial metals (or cyclical commodities in general) until I get some technical reason to like them. Continue reading "Pre-Fed Precious Metals Update"