Gold Bugs, How Deep Is Your Love?

The title of my previous update was “Calm Before Storm”, and it was not “clickbait” as I spotted a telling market structure that appeared on the chart as a huge visible consolidation had emerged.

Indeed, a sharp move higher followed that post after the consolidation mentioned above had broken out. That move was strong enough to overcome the barrier of the potential triangle’s resistance above $1360. This has invalidated the second option (green arrows) of intermediate triangular consolidation on our master chart. As time goes by, the dust settles, and the chart structure gets clearer eliminating one option after another until only one single way to go remains.

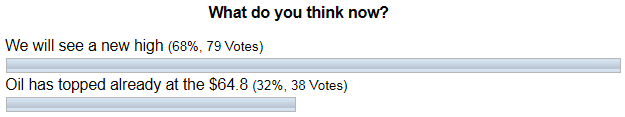
The gold advanced as high as $1437 so far, let’s see how you felt the market one month ago.

gold

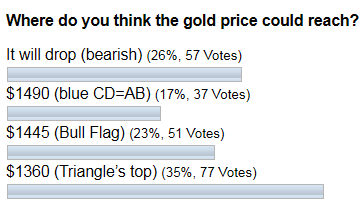
Most of you thought that the triangle’s top could stop the market at the $1360 level, but at the same time, you were optimistic about the gold move although a bit conservative. It is interesting that in second place, the votes were given to an opposite bearish scenario. This confirms the idea that market forces are struggling during consolidation, as trading opinions are polar. There is a Bull Flag’s target on the third place, and it is the closest result so far, my congratulations to those who hit that option.

I cleaned the master chart below for you to focus only on one option, and I extended the view there. Continue reading "Gold Bugs, How Deep Is Your Love?"

Gold Miners Waiting On This Chart

It’s not a chart of nominal HUI with upside technical targets. We’ll do that in NFTRH this weekend, along with the usual individual miners. Rather, it’s a companion to other charts we’ve been reviewing over the last several months showing the undervaluation of the gold stock sector relative to gold’s performance vs. cyclical assets/markets. For example, gold has risen strongly vs. the CRB index and that is a sector fundamental undervaluation.

gold crb ratio

But on the macro picture, do you think that maybe gold stocks would benefit if gold manages to turn up vs. the US stock market? This chart appears to hold the key. HUI has been in a beautiful correlation to Gold/SPX since the 2011 top. To this point, the ratio has not turned up but you can see why I harp so much on the need for Au/SPX to get in gear. If it does, and joins Au/CRB and others, hang on to your hats and prepare for some upside targeting beyond the bounces of the last few years. We’d then go from identifying value mode to acquiring targets mode. Continue reading "Gold Miners Waiting On This Chart"

Don't Get Trapped By Recent Dollar Weakness

Last week I promised to the reader who commented on the dollar index’s strength under my silver post, that I would write a separate piece about the king currency.

Here we are, and I will start from the very long term chart, and you will see why I answered in my comment that it all depends on which time frame we are looking at as these days as the dollar index is falling. Should we worry about it?

Chart 1. Dollar Index Futures Quarterly: Correction

Dollar
Chart courtesy of STOOQ.com

This is a long-term view of the dollar as almost 50 years passed since 1971. For the whole period, the maximum price was established in 1985 when the dollar index hit 164.7. After that, it dropped like a rock down to the 78.4 in 1992. And then we can see a huge correction that had reached exactly a 50% Fibonacci retracement level at 121.5 in 2001. That strength of the dollar turned out to be short-lived as another drop followed. This time it had fallen much faster as it quickly reached the former trough and after a small consolidation, the index slid further down to a new four-decade low of 71.1 in 2008 amid the financial crisis. Continue reading "Don't Get Trapped By Recent Dollar Weakness"

Are You Waiting Crude Oil At $20?

Last month the crude oil futures hit the target much earlier than it was planned. When the target was reached, I started to think of a reversal to come as the overall structure of the chart implies it. This thought was based on the deep retracement of the price, the overall completion of the pullback, which hit the broken resistance, and not in the last place due to the 100% progress of the CD segment (CD=AB). I shared it with you along with the crucial downside triggers in the weekly chart of my earlier post.

Let’s see how you felt the market those days in the last ballot’s results below.

Crude Oil

You are just amazingly accurate in predicting the future! Again, the majority of you were absolutely right as crude oil futures established a new high of $66.60 beating the earlier top of $64.8 for almost two dollars. I am very grateful to all of you who read my posts here at INO.com and support my chart experiments with likes and votes.

Let’s move on as the weekly chart below shows that not only the new high was established. Continue reading "Are You Waiting Crude Oil At $20?"

Bitcoin Duplicates Gold Chart

“It's not gods who make pots” as investors move the market, pushing the buttons and sending the orders to the marketplace. It’s clear that they tend to behave one way or another, and that’s why patterns exist and appear from time to time as “there is no new thing under the sun.” It doesn’t matter what the instrument is it, let it be a very old commodity or a new digital asset, it is people who “worship” it, make it valuable and move the price of it.

Bitcoin caught the hype again recently after a disastrous 2018 when it was just falling all way down. I would like to share with you an interesting similarity in the chart structure of “perpetual” gold and Bitcoin aka “new gold” to find out if this rally is a part of something bigger.

Do you think Bitcoin is a good investment?

View Results

Loading ... Loading ...

Let’s start from the monthly gold chart as it is a model for the Bitcoin chart. Continue reading "Bitcoin Duplicates Gold Chart"