White And The Whiter: Who Let Palladium Out?

Aibek Burabayev - INO.com Contributor - Metals


Dear INO.com Readers,

New month, new everything!

Monthly Platinum chart

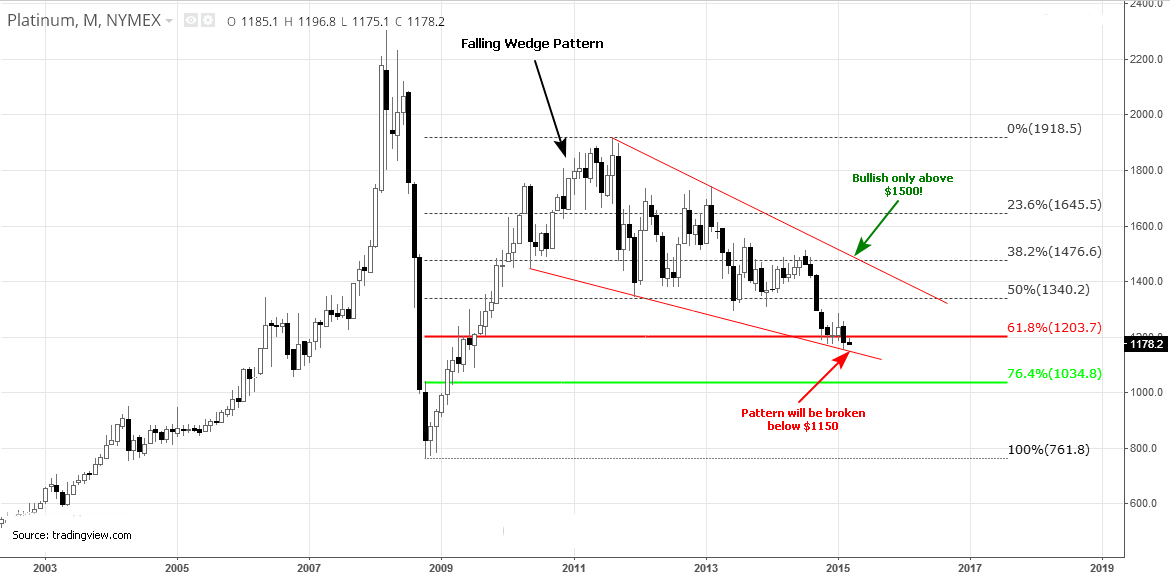
As seen on the above monthly chart, Platinum spent a pretty quiet season inside of a narrow $100 range, sitting on the 61.8% Fibonacci level around $1200, trading with a discount to Gold. February closed lower at $1185, with the monthly low at $1155 and touched the falling wedge pattern's support. Price couldn't accumulate enough momentum to fulfill the pattern so far. The pattern is bullish and to bring the bullish track the white metal would need to overcome the wedge's resistance at $1500 and two Fibonacci levels at $1203 and $1340 on the way to it, difficult but still a possible task.

I don't rule out that with such an unconvincing performance, the bears would try at another chance to break below the wedge's support at $1150. That will negate the model and the price could quickly reach the last Fibonacci support at the $1034 level. I don't want to be too cruel and imagine what would be next after that. Continue reading "White And The Whiter: Who Let Palladium Out?"

Chart of The Week - Corn to Move Higher

By: Chris Wilkinson of Longleaftrading.com

Corn has been in an upward trend since it put in its lows at the beginning of October. From there the chart has traded a series of measured Fibonacci levels all the way into profit targets each time. Last week's correction brings us right at the next Fibonacci sequence to take a long position and stick with this trend.

For a review of the previous Fibonacci sequence that traded into profit targets we draw the Fib tool from the lows of November 19th (362.5) up to November 28th highs (393.75). With this drawn you can see the market pulled back and found support right on the 50% level and traded directly into its first and second profit targets, the -23.6% Fib level and the -61.8% Fib level. See the Chart below.

4 Hour Chart Corn

Now that the previous move has corrected we continue to draw the next series until we get to one that fails the 61.8% level. A failure happens when we get a strong close on a large time candle. An hourly close or higher is sufficient to call it a failure. Normally smaller time frames will trade back and forth around those levels so I look to larger time frames for confirmation. If a failure happens it is assumed the trend is over and the next one begins in the opposite direction.

The next move found by using the Fibonacci tool is drawn from the support of the previous move. We use the lows of December 3rd (377.25) and draw it all the way up to the new highs on December 29th (417). See Chart Below. Continue reading "Chart of The Week - Corn to Move Higher"

Understanding the Basics of Technical Analysis

Whether you are trading stocks or currency, technical analysis is an advanced tool used to try and predict changes in your market and trade accordingly.

At the base of technical analysis is price history. You are studying the price of a currency, it’s up and downs, and looking for an obvious indicator that will tell you when another up or down is coming up. Think of it like trying to learn to read tea leaves to see the future – except there is real science behind it.

Using Charts For Technical Analysis

The most basic tool for technical analysis is your chart or graph. Whether you are looking at a line graph or candlesticks, the Forex trading chart is giving you a wealth of information. First, you can check the support and resistance. These are the points where it seems that the currency pair won’t cross. Is there a certain range in which the currency is moving? When you see a price making sudden movements in that range you can use the support and resistance to predict when it is going to change its direction again.

Trend lines can be used when there is a definitive pattern that you can follow. You can chart the trend line if it is moving in one direction to predict where the price is going to go using indicators.

For example, let’s say you are studying a candlestick chart -which you should as they give you more indicators in one convenient place. This type of chart can help you to find trends that indicate a major reversal is about to take place. One indicator you can look for is what traders refer to as “three white soldiers” which indicate a bullish reversal is pending. Continue reading "Understanding the Basics of Technical Analysis"

10 Game Changing Stocks To Watch In 2015

Hello traders and MarketClub members everywhere! There is no doubt about it, 2014 has been quite a year. As the year winds down, I thought I would take a look at 10 very popular stocks from 2014 and discuss what I see happening to these stocks in the beginning of 2015.

Looking at these 10 stocks, I can quickly see that only two of them actually remain in bull market mode. Of the remaining eight, four stocks are in a neutral or trading range mode and four stocks are in bear market mode.

Regardless of what happens to the economy in 2015, these 10 stocks will move either up or down and that's what's important. If profits are what you are after, you need to be in stocks that move and have good liquidity. You cannot make good money when a stock is moving sideways.

In today's video, I will be examining technical tools that you can use to sharpen your trading skills in 2015. I think you will get a lot out of these trading tips to help your trading be more successful.

Traders! Don't miss out on MarketClub's Special Holiday Promotion! Try the tools for 30 days for only $8.95, then take advantage of a Special Holiday Rate for 90 additional days of access (Save 40%!).

Every success with MarketClub,
Adam Hewison
President, INO.com
Co-Creator, MarketClub

They Do Ring A Bell At The Top Of The Market

Hello traders and MarketClub members everywhere! Just this morning I was thinking of an essay I had read many, many years ago. The intriguing feature to me was the headline which read, "They Do Ring A Bell At The Top Of The Market."

Well, I have to say it was an intriguing headline which got me to read the article, perhaps like you're reading this post now. The essence of the article was when interest rates go up, they usually signal a top in the market. As we all know, we have had unusually low interest rates for a prolonged length of time with one QE after another. All of which has boosted the stock market, but I believe the jury is still out on the economy.

With the end of quantitative easing, it's only going to be a matter of time before the Fed begins to raise interest rates. So the question is, how is that going to affect the markets? On one side of the coin, you can argue that it is only going to be good for people that have fixed incomes and rely on bonds and interest-bearing instruments. On the other side of the coin, will investors be willing to risk hanging in the market if they can get a return elsewhere with little or no risk? Continue reading "They Do Ring A Bell At The Top Of The Market"