

It’s ironic that people often get puzzled when they get what they wanted or dreamt about. Those who had dreamt of having a baby often panic when the baby is born and think what should we do with this cute toddler?
We are now in the same situation. I called for market a reversal last month and now we got it! Hmm…what’s next? Now that my prediction raised a ton of money I need to carry on using chart analysis only.
Chart 1. Gold Daily: The Santa Claus Rally!
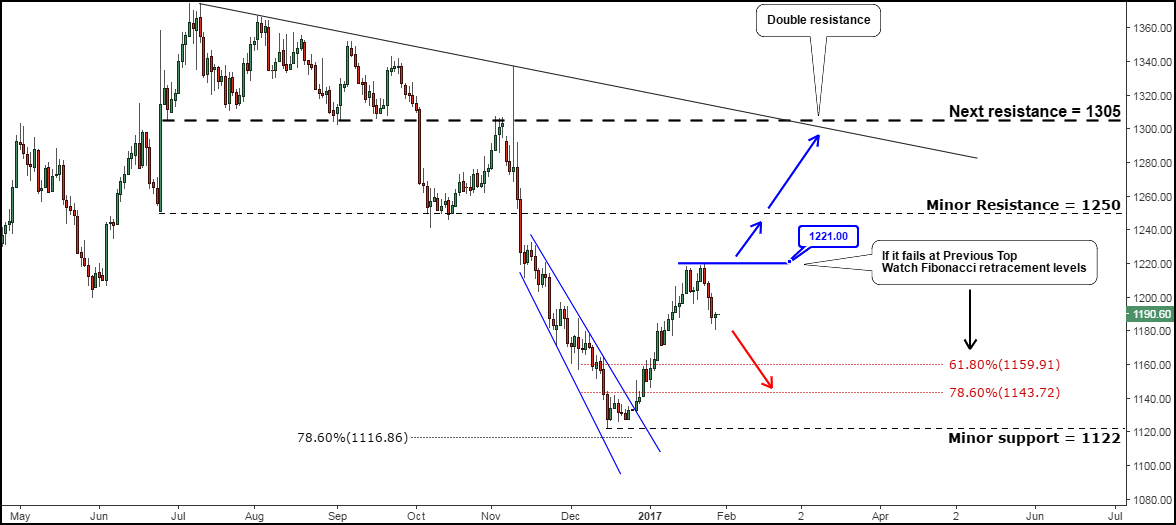
Chart courtesy of tradingview.com
It was not easy at all for gold to escape from captivity of the blue downtrend. I extended it on the chart above to cover the whole move down as in the previous chart it was half as short as such deep was this move.
The metal spent another three weeks after my previous post under the Bears’ pressure before the Santa Claus Rally started on the 27th of December. The accumulated divergence with the RSI indicator made a loud shot, gold just didn’t look back and ran quickly to the top of the $1218 mark breaking up the round figure on 17th of January. It was a quite decent gain, almost $100 per one month or 8.5%.
Then the price dropped down to the $1196 level and again moved up making a zigzag back to the $1221 level. This shaped the tiny Double Top pattern (not shown on the chart not to overload it), which reversed the price again down below the Neckline at $1196 to Friday’s low at the $1180 mark.
Now, as always, there are just two options, rise or fall. If this was the whole correction of a new upside move, then we should watch closely if the price breaks the current top established at the $1221 level again and continue to grow. To book another $100 from here gold should pass over the Minor Resistance at the $1250 mark (2016 June low and 2016 October consolidation area).
After that we would see a tough fight ahead of the double resistance established at the $1305 level where the black upper trendline and long lasting consolidation area crossed. If the next move exceeds the previous rise by one of the Fibonacci extension ratios (1.618 or 2.00) then there will be no problem to surpass this strong barrier, which puts downside pressure on the market. The strategy here should be simple, to buy on the breakup of the $1221 level with a stop under the current low (if it would be Friday’s low then below $1180).
If this Santa Claus Rally turns out to be another correction before a new drop, then we should closely watch the Fibonacci retracement levels shown in the red on the chart. The last barrier before the complete capitulation of bulls would appear at the medium-term low established at $1122. The break of it would open the way down to the major low at the $1046 mark.
Chart 2. Silver Daily: Inverse Head And Shoulders
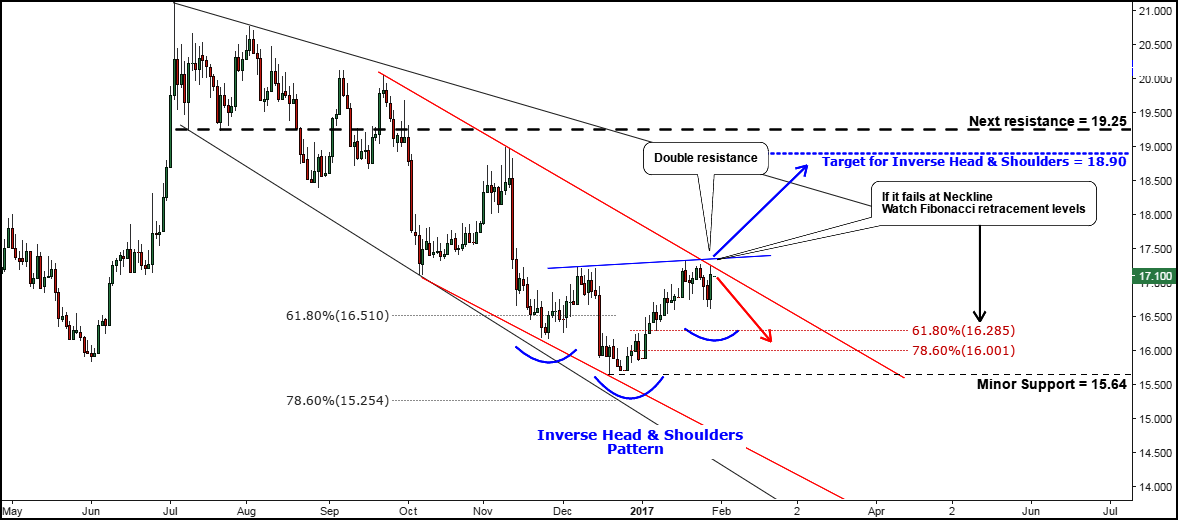
Chart courtesy of tradingview.com
Readers often doubt how these top metals could have different trading setups. You know that even twins have different habits, styles and preferences. These metals have one major similarity, they both are precious. We always witness how different the chart structures are of these metals: if one reverses the other one keeps with an old trend as it was last December when the silver broke the downtrend ahead of gold.
That breakup was promising as the price rocketed above the $17 handle, but it turned out to be short-lived. Silver managed to reach only the start of the downtrend at $17.23 in the middle of December, but failed there. The small Double Top pattern established there and pushed the price down heavily below the November low ($16.17) establishing a new low at $15.64. It reached the downside of the red declining channel, which I added this time to contour the narrowing range of the move within a black larger expanding trend.
Santa came to silver’s “house” at the end of the year, bringing a strong rally to the previous tops’ area, which hit the $17.33 mark. This metal also has a small Double Top pattern in the chart like gold with one big difference, the downside move had already reversed on Friday with the price hitting back above the $17 handle while gold has the small green candle below the Neckline. This is further evidence of the different price actions of these metals, especially at the decision points.
The Inverse Head & Shoulders pattern was detected and highlighted on the chart for you in blue semicircles. It’s a bullish price formation. To execute it, the market should break above the Neckline of the pattern located at $17.35. There is a double resistance here as the Neckline is strengthened by the red upper trendline. The target set at the $18.90 mark (the depth of the Head added to the Neckline) just below the downside of the consolidation area at the $19.25 level. Silver should also violate the long-lasting black upper trendline resistance to reach the destination point. The trade here should be based on the breakup of the Neckline with a stop below the current low like it I described in gold’s part above.
The failure to crack the Neckline would put the downside pressure on the price and then we should watch the reaction of the Fibonacci retracement levels highlighted in red. The last hurdle is set at the previous low at the $15.64 mark. The price should stay above it to keep the current model.
Watch both metals’ price action closely as you can find useful clues at one market to play it in your favor on the other.
Intelligent trades!
Aibek Burabayev
INO.com Contributor, Metals
Disclosure: This contributor has no positions in any stocks mentioned in this article. This article is the opinion of the contributor themselves. The above is a matter of opinion provided for general information purposes only and is not intended as investment advice. This contributor is not receiving compensation (other than from INO.com) for their opinion.
For Gold, only hope after and if it can close above $ 1232 for three constant close.
This is a great analysis for the metals......but it doesn't take into account the manipulation by the banks and the Fed.
Technical Analysts wouldn't have a job if they admitted to PM manipulation.
Amen to both comments above. Want the best indicator of where prices will go? Learn about and follow the COT and how short the commercials are, and you will be better informed. In time the paper/digital/contract pricse won't rule the physical, but for now it does. Longer term metals have to go up measured in dollars.
The POG is clearly being manipulated....(the dollar to gold ratio is currently sitting at approx. $9,000 per oz)
http://www.usdebtclock.org/gold-precious-metals.html
Based on where the dollar is currently at (DXY 99.5), gold should be far above the $1230 mark if not for the price suppression by the banks and fed.
I know that technical charting is a valid indicator of any given market trend. But how valid can any indicator be when the controllers can make the trend go in any direction they desire. And this ability to do this has been proven without any doubt or discussion. It's fact. So for me, the trend is whatever the controllers want for the day---until they lose control. And that ability seems to be ending with each passing day.
If live trading is watched each day, the metals are smashed by the controllers each day at the same times, and mostly in the same fashion. Plus, for the controlling entity, how can they possibly never have a down day on their trades in metals? This is impossible unless they control the markets.
Touche' 53. T/A used to have relevance before the advent of HFT computers with algorithms front running every trade, moving the market where ever they are pre-programmed to move it.