
Both triggers were pulled in the precious metals since my last post about gold and silver. I hope it is interesting for you to see how you voted about the metals price action in that article.
Let’s start with the gold votes below.
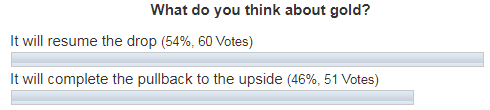
Most of you (54%) thought that gold would resume the drop. It was a slight edge over the other option where you chose the completion of the pullback. Let’s check in the chart below to see what actually happened with the gold price since then.
Chart 1. Gold Daily: Second Leg Of A Pullback
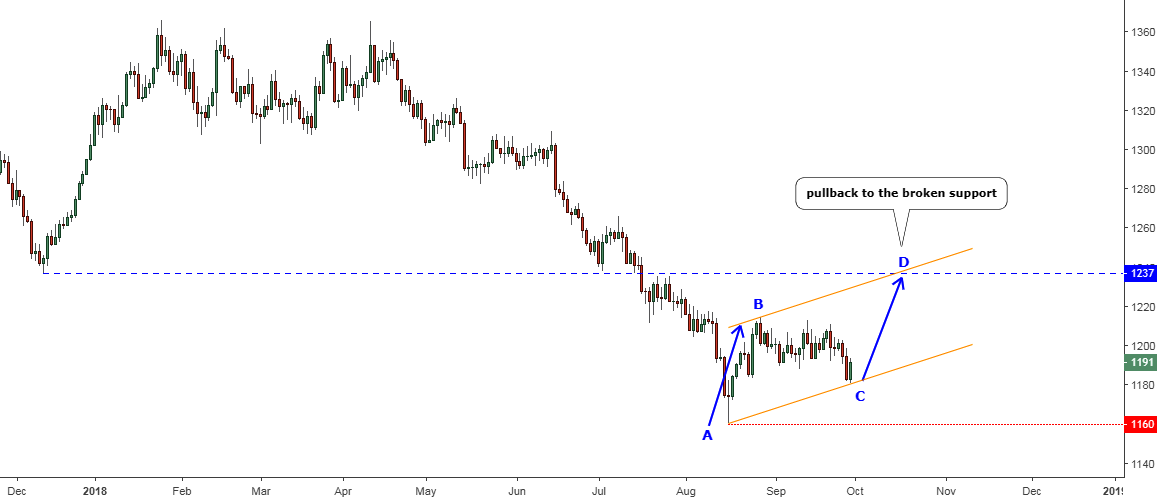
Chart courtesy of tradingview.com
The price of gold has finished the consolidation highlighted with the thin red down arrows in the earlier chart between the B and the C points of the blue AB/CD segments. The simple measurement pointed at the $1180 level, where I said the CD segment should start. Indeed, the gold has hit the $1181 low within the BC part and then bounced up towards the end of the last week to close at the $1191. This is the magic of simple math, which occurs in the charts again and again.
Once the C point has been established, we should simply add the distance of the AB segment to it to find the D point on the chart. I added the orange parallel channel to contour the whole pullback and highlight the projection of the D point for your visual comfort. And here is another magic coincidence, the D point hits right in the valley of the last December low, which was strong support before it was broken this summer. Now it turned to be strong resistance, but it is yet to be proven if it’s good enough to stop the emerging pullback.
The closest support is still intact as the bears should clear the earlier low established in the $1160 area.
Now let’s move to a revived silver and see how you voted.
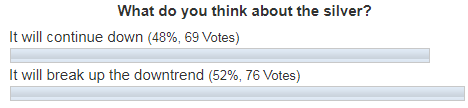
The majority of you (52%) believed that the metal would break up the long-lasting downtrend. The rest with a narrow gap (48%) chose the resumption of the drop. The actual price action is in the chart below.
Chart 2. Silver Daily: Downtrend Was Broken
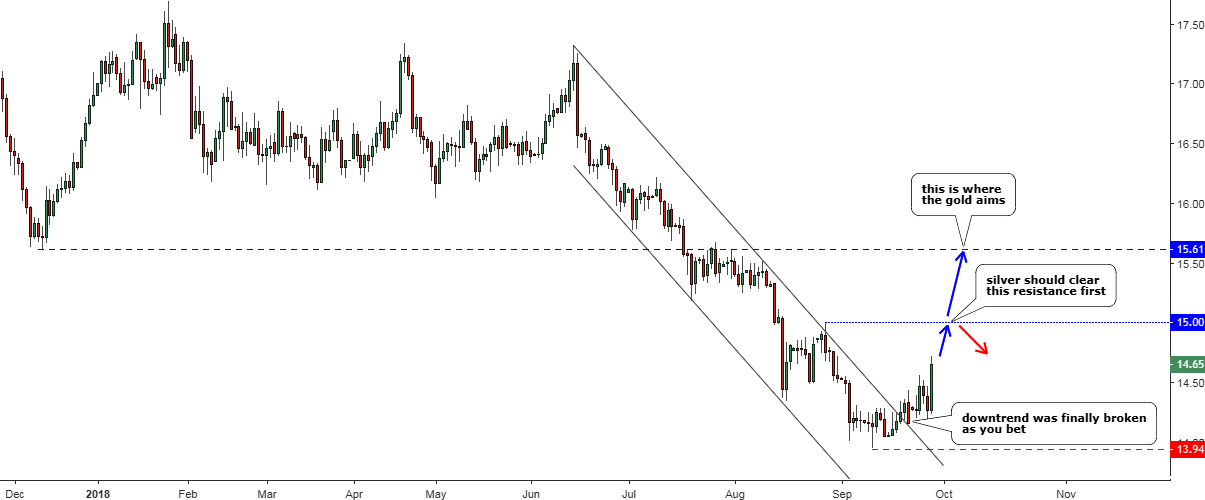
Chart courtesy of tradingview.com
Yes, most of you were right as the metal finally broke out of the downtrend (gray) in spite of being submissive for so long.
Silver has started the pullback with small moves inside of the downtrend and only last Friday it finally showed its full height with a big green bullish candlestick. This makes it difficult to build a clean AB/CD segment like the one that emerged in the gold chart as the last strong move up is already much bigger than the initial segment.
Here we could rely only on the horizontal resistances which were highlighted in the chart. Silver dropped much deeper than gold, and that’s why it should clear additional resistance at the round number level at the $15 (earlier top) before it could reach the same area where gold aims. That level is located at the $15.61 where the last December low was established.
The hope that the silver long could bring more money than the bullish gold position (6.5% vs. 3.9%) spurred that strong demand last Friday in the oversold white metal. So, watch gold closely as we have a clear plan there to understand the next silver move better.
The invalidation for this pullback is still there on at $13.94.
Intelligent trades!
Aibek Burabayev
INO.com Contributor, Metals
Disclosure: This contributor has no positions in any stocks mentioned in this article. This article is the opinion of the contributor themselves. The above is a matter of opinion provided for general information purposes only and is not intended as investment advice. This contributor is not receiving compensation (other than from INO.com) for their opinion.