Alphabet, Amazon and Apple All Have Something In Common

Hello MarketClub members everywhere. Well, here we are at the end of one extraordinary week for the equity markets. I don’t remember a week where we watched the major market indices rally so dramatically from a bearish position in just three days.

In today's post, I'm going to be looking at the big 3 A's, Alphabet, Amazon and Apple. What these three stocks have in common is that they are all in downtrends and they all formed a negative (bearish) engulfing line yesterday. Should any of these three stocks close lower today, they will confirm that the high on Thursday will be a formidable resistance area for these stocks to overcome in the future.

Alphabet Inc.(NASDAQ:GOOG)

Trade Triangles: Weekly red, Monthly red, overall trend is bearish, trend strength -85.

Daily Chart of Alphabet Inc.(NASDAQ:GOOG)

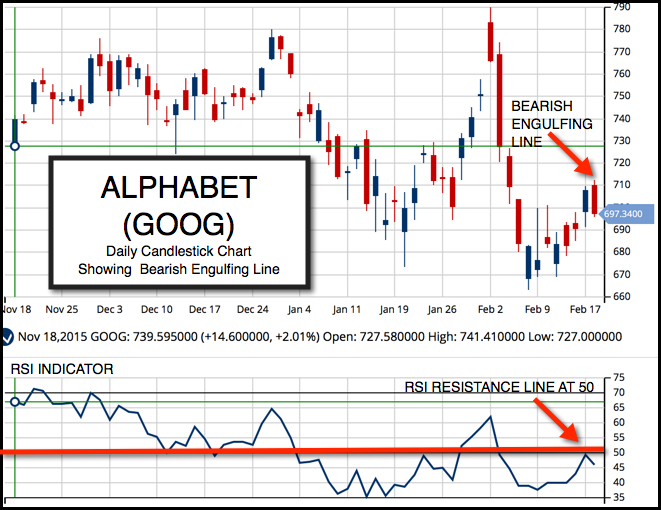
Alphabet has a negative trend at the moment even though it has been extraordinarily strong in the past several years. It's not to say that it's going to hell in a hand basket, but rather it will begin to reflect a slowing economy that is evident in both the retail and dining sector. I would view a close below $697.34 as a confirming signal that it has put in an interim top and is going to retest its recent lows. Continue reading "Alphabet, Amazon and Apple All Have Something In Common"

Bull Market Or Bear Market, Which Is It?

There's no doubt that the dramatic 800 point rally we have seen the past three days is practically unprecedented, but did it change the major trend of the market?

The simple answer is no, the longer-term trend for the equity markets at the moment remains negative. But please don't misunderstand what I'm saying, I was as surprised as anybody at the velocity of the rally which exceeded the Fibonacci retracement levels I discussed recently.

Today should be an interesting day to say the least, and I doubt seriously that the market can close higher and would expect to see some sort of pullback from the current levels. There is also what I would consider to be a major resistance based on the highs that were hit on Feb. 1st at the 1939 level on the S&P 500. Providing that level holds, we are still basically in a downward trending market, albeit a choppy one.

Gold

The pullback in gold (FOREX:XAUUSDO) appears to be consolidating, which is good given its rapid move to the upside. In an ideal world, I would like to see gold continue to consolidate around the $1200 level before once again moving higher. I still believe that gold has broken the back of its four-year bear trend and has now embarked on a long-term bullish trend that could take it to the year 2020. Be sure to watch the Trade Triangles for signals that gold has once again embarked on an upward move. Continue reading "Bull Market Or Bear Market, Which Is It?"

Leaning Into This Bear Market Rally With Call Credit Spreads

The rally since the lows has been like a runaway freight train, or maybe more like a charging bear. Speaking of, this is starting to smell like a bear market rally and today was the ideal spot to lay out some call credit spreads into Fibonacci and Elliott Wave resistance.

Learn more about TradingAnalysis.com here.

Plan Your Trade, and Trade Your Plan,
Todd Gordon

This Stock Could Appreciate 50% In The Next 6 To 12 Months

In case you missed it yesterday, Alibaba Group Holding Limited (NYSE:BABA), took a 5% position in Groupon Inc. (NASDAQ:GRPN) which was enough to push this stock up 40%. Yesterday's action by Alibaba was seen as a black swan event that could not be predicted by any indicator. Groupon had been in a steady decline after hitting a peak of over $27 when it began trading. Since that time, the stock has steadily moved lower and recently traded perilously close to the $2 level.

As I have said many times before, perception is very important in stocks. The fact that Alibaba took a 5% stake in this company should not be overlooked.

Technically speaking all of the Trade Triangles turned green and positive yesterday for the first time in a long, long time. You also saw a 12 month downtrend line broken to the upside which also helped change Groupon's momentum.

Daily Chart of Groupon Inc. (NASDAQ:GRPN)

With all of these positives happening to Groupon, how high can this stock go? Continue reading "This Stock Could Appreciate 50% In The Next 6 To 12 Months"

Has Gold Suddenly Lost Its Glitter?

Hello MarketClub members everywhere! Here we are starting a new trading week and the big news is a sharp rally in equities and a big pullback in gold. The question on everyone's mind is, "is this for real or just a rally in a bear market in equities and a pullback in the bull market for gold?"

Gold

Let's take a look at gold, first of all. I believe that the gold (FOREX:XAUUSDO) market has finally come to life again after hitting a peak in August 2011 and then losing the half its value over a period of four years.

Looking at a long-term chart of monthly gold prices you can see that (2) was the first time that gold had moved below the RSI 50 line. This long-term indicator was showing you that gold prices were in serious trouble. It is also worth noting that the RSI indicator (3) has stopped every rally in gold. I expect to see more consolidation in this market and then see gold break over its resistance at the RSI 50 level. When that happens, expect to see a potential multiyear bull market to take place in gold.

Monthly Chart of Gold

Continue reading "Has Gold Suddenly Lost Its Glitter?"