Chart of The Week - Natural Gas

Each Week Longleaftrading.com will be providing us a chart of the week as analyzed by a member of their team. We hope that you enjoy and learn from this new feature.

This week's focus turns to the March Natural Gas futures, where strong price action stemming from bullish fundamental data gives way to a possible buying continuation. Total Natural Gas storage stands at 1.686 bcf, or 27% below the 5-year average. This draw in supply has been aided by recent extreme cold temperatures across the United States.

After posting a recent swing low of 4.563 last week on Monday, February 10, 2014, the market has experienced a sharp climb in prices. Last week, we also saw the 20 day moving average act as support for the bullish market on multiple occasions, making this indicator a key support level in a swing trade opportunity.

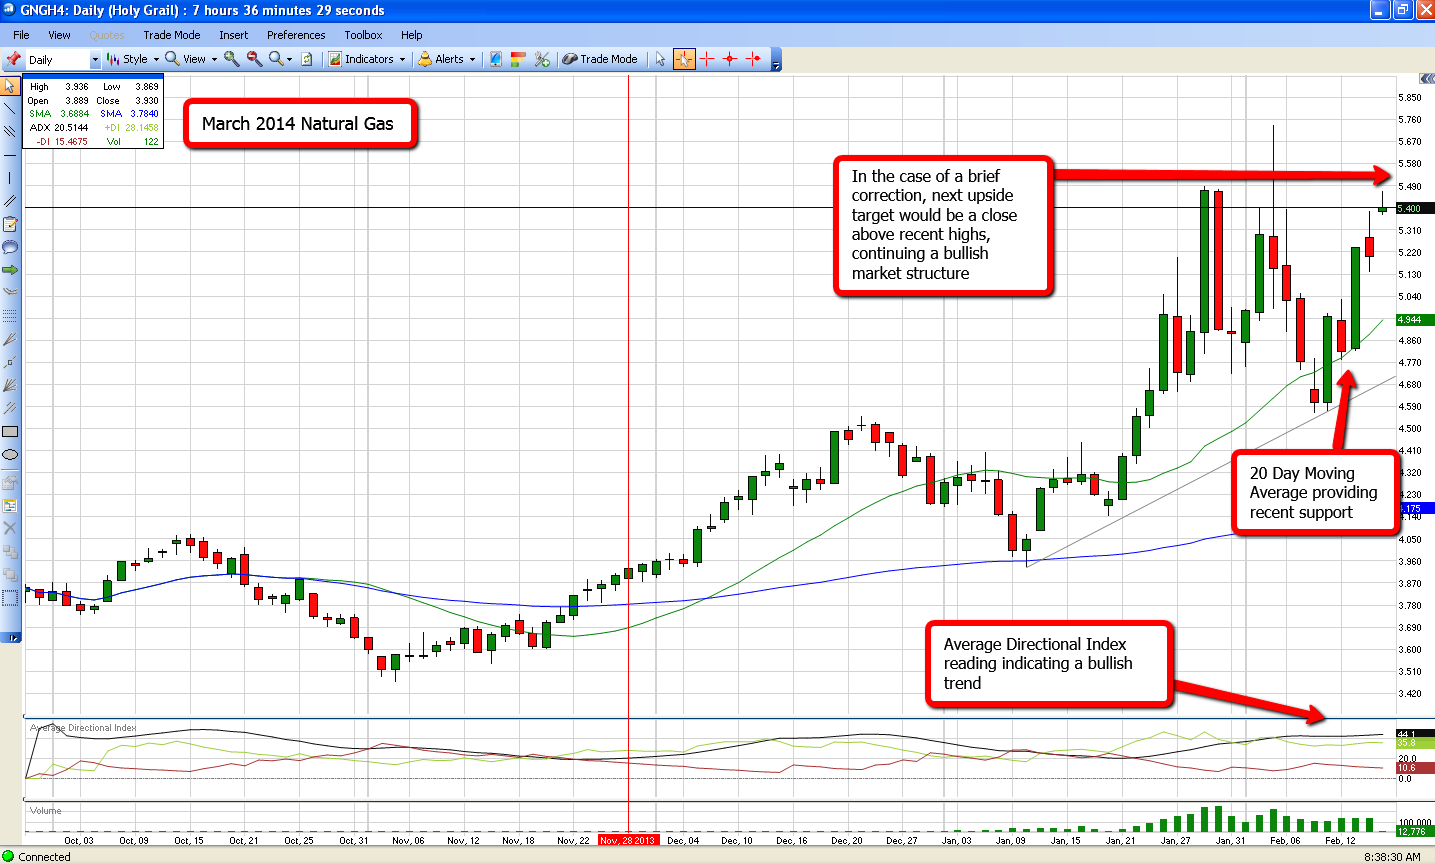
As we start this week, we have seen yet another push up to the 5.400 level, indicating the Natural Gas market still holds a bullish sentiment. Continue reading "Chart of The Week - Natural Gas"

Want a Sure-Fire Forex Trade Setup? Look for a Triangle

Watch this quick educational video from an Elliott wave forex expert, Jim Martens

By Elliott Wave International

Last fall, the editor of Elliott Wave International's Currency Pro Service, Jim Martens, observed a beautiful pattern in the chart of the Japanese yen. This pattern, called a triangle in Elliott wave terms, offers a very clear outlook for the market.

What is a triangle? It's a corrective pattern, meaning that it moves in the direction opposite the primary trend. And, it's very easy to spot on a chart. Here's an idealized diagram of a triangle.

When a triangle ends, the old trend should resume. This allowed Jim to make a very clear forecast for the dollar/yen. Watch this 7-minute video to see the triangle he observed, and the outcome. Continue reading "Want a Sure-Fire Forex Trade Setup? Look for a Triangle"

Precious Metals Grind Out a New Trend

Gold is Monetary Value

We preface the post with a statement that has not changed since I began public writing nearly 10 years ago:  Gold is not about price; gold is about value.  This point was hammered home to me 11 years ago by a person who had much influence upon my viewpoint toward the financial system and its various diseased components at a time when I was ready to listen and understand.

So whether we are talking about 2013′s epic price crash or a new bull trend in 2014, the simple fact is that physical gold itself is a store of monetary value.  That applied last year as the value was marked down by greed and confidence and it will apply this year as it is marked up in the face of a likely unwinding of those things.  Humans, what funny and hyper kinetic animals. Continue reading "Precious Metals Grind Out a New Trend"

Weekly Futures Recap With Mike Seery

We’ve asked Michael Seery of SEERYFUTURES.COM to give our INO readers a weekly recap of the Futures market. He has been Senior Analyst for close to 15 years and has extensive knowledge of all of the commodity and option markets.

Michael frequently appears on multiple business networks including Bloomberg news, Fox Business, CNBC Worldwide, CNN Business, and Bloomberg TV. He is also a guest on First Business, which is a national and internationally syndicated business show.

Gold Futures

Gold futures in the April contract finished higher by another $20 an ounce at 1,320 climbing higher for the 7th consecutive trading session hitting 3 month highs and this market looks terrific to the upside and I’m still recommending long positions as I think prices will retest the 1,360 level as the commodity markets have caught fire to the upside. The U.S dollar continues to decline against the foreign currencies and that is starting to push gold and many other commodities higher as gold is now trading above its 20 and 100 day moving average showing you that the trend is higher with outstanding chart structure so continue to play this with either a long futures contract or look at some June bull call option spreads as I think there’s a chance prices could head up to 1,400 come springtime especially if the U.S dollar makes contract lows. Continue reading "Weekly Futures Recap With Mike Seery"

The Perfect Valentine's Day Gift

Time is running out, are you still looking for that perfect Valentine's gift for a loved one? If you answered yes, this may be the perfect gift that you have been looking for.

It may not be the little blue box that so many women love, but the stock of Tiffany & Co. (NYSE:TIF) is just as valuable.

As you can see on the chart, Tiffany & Co. was selling below $20 a share back in March of 2009 and since that time this stock has risen over 400%. I think the current climate and chart formation is setting up for this market to have another push into new highs.

There is a long-term trend line that starts back in March 2009 and this line is confirmed in July of 2012 and again in January of 2013. This trend line is significant and should it be broken, it would definitely change the trend of Tiffany's stock. Continue reading "The Perfect Valentine's Day Gift"