The Rebels From Reddit Favor Silver

The internet is still one of the most revolutionary things invented. The new level of communication and coordination it gives us is just amazing. Hedge funds could not imagine a sudden coordinated attack that started as a post on Reddit could impact them so hard. The next market in their crosshairs? Silver!

The GameStop frenzy just let the dogs out. Lately, the retail investors from the famous Reddit chat Wallstreetbets started looking towards the iShares Silver Trust ETF (SLV) as they are looking forward to profiting from the same strategy of short squeeze earlier mastered on GameStop shares. They chose SLV ETF because its shares are backed with physical silver.

I prepared two silver charts to show you how the retail market force changed the structure and its outcomes.

Silver

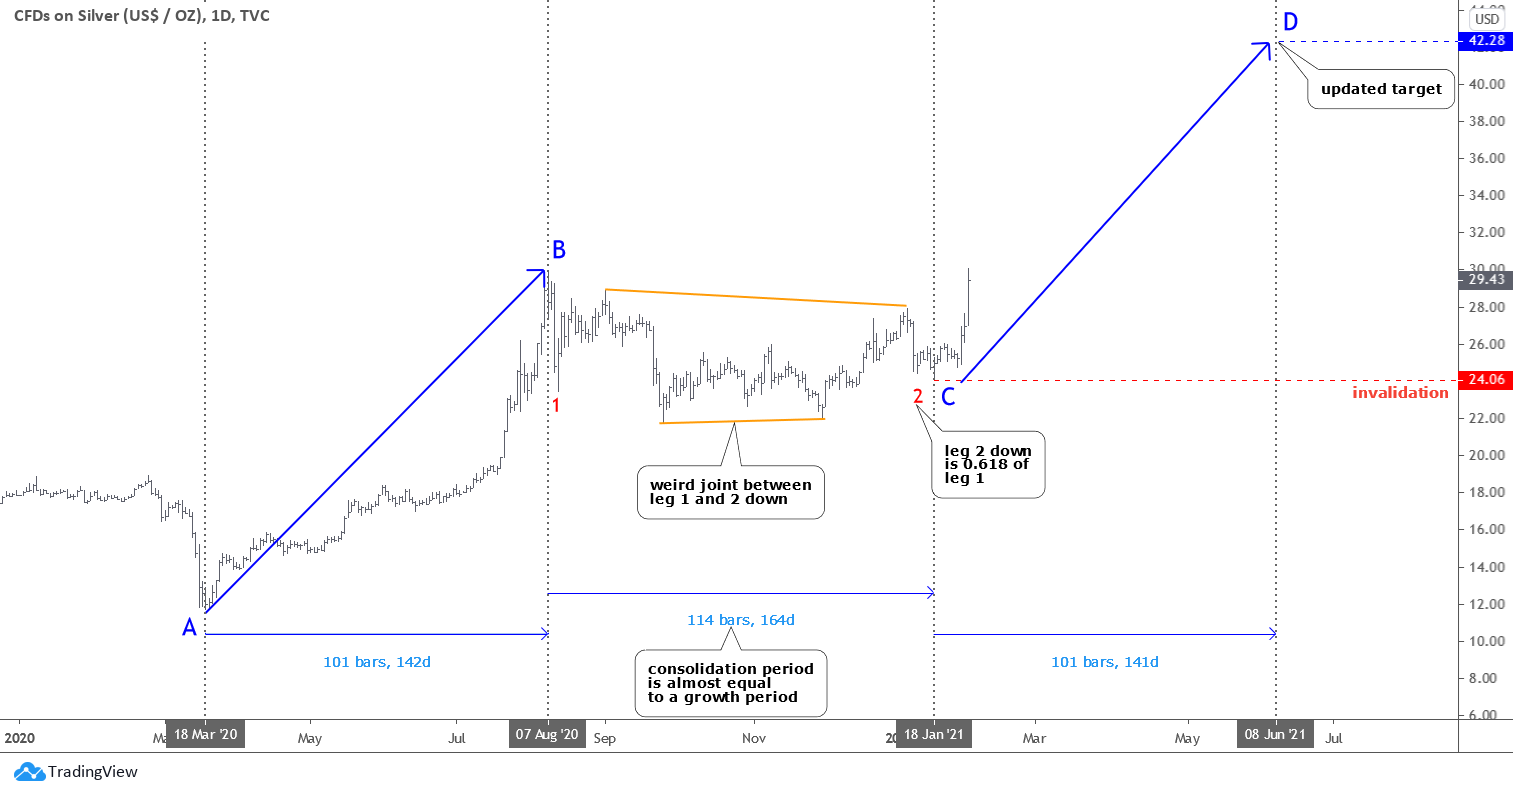
There is an optimistic scenario depicted in the chart above. It implies the completion of the entire corrective structure. The red leg 2 down is considered to be done as it traveled only 0.618 of the red leg 1 distance. As you may remember, it is the Fibonacci ratio. The joint between legs 1 and 2 looks weird but is yet possible. Continue reading "The Rebels From Reddit Favor Silver"

Can The Silver Bugs Alter The Macro?

As to the post’s title, they sure are trying. Despite doubts that the stodgy old likes of me may have.

Silver

But for two days at least dem bugz is successfully battlin’ dem boyz on da COMEX. The result is that the Silver/Gold ratio (weekly futures chart) has been rammed to a new high for the post-crash move. If we back completely away from the #silversqueeze punchbowl, this is an indicator guiding the way for forward inflation.

silver gold ratio

So again, can the silver bugs alter the macro? Are the silver bugs altering the macro or is silver just doing what it has been technically capable of doing all along? Since well before #silversqueeze (a ‘me too!’ operation to the famous Reddit plays of late) was promoted by its originator, gold had been trending down vs. silver. Continue reading "Can The Silver Bugs Alter The Macro?"

Post Inauguration And Extended Markets

Best Post Election and Inauguration Lift

The drumbeat of markets becoming more and more over-extended is becoming louder and louder. From the election to the inauguration, the S&P 500 is up 13%, which is the best for any president since 1952. Post-inauguration, all major indices as measured via the Russell 2000 (IWM), Dow Jones (DIA), S&P 500 (SPY), and the Nasdaq (QQQ) hit all-time highs. The broader markets have been propelled higher in an already frothy market as 2021 unfolds. All major markets have been in a raging, nearly uninterrupted bull market with the Nasdaq and S&P 500 up 100% and 75%, respectively, since the pandemic low.

These moves are a function of the vaccine rollout, continued stimulus coming out of Washington, massive fiscal and monetary accommodation from the Federal Reserve, the election cycle being capped off with the presidential inauguration, and new policies aimed at spurring economic growth. Despite these tailwinds, the markets are looking overextended, as assessed by a broad range of historical benchmarks and current indicators investors should heed in the near term.

Historical Measures and Current Indicators

A recent E-Trade survey showed that the majority of investors (91%) with $1 million or more in a brokerage account believe the stock market is in a bubble or close to being in one. From a historical standpoint, markets have exceeded levels reminiscent of the Roaring Twenties and are now approaching the dot-com bubble territory. These historical comparators of options put/call ratios, the broad participation of stocks exceeding their 200-day moving average, and P/E ratios may be potential warning signs of near-term pressures. Current indicators are also suggestive of frothy markets as measured by Bollinger bands and the Relative Strength Index (RSI). Continue reading "Post Inauguration And Extended Markets"

Stock Market Feels The Squeeze

The DOW dropped more than 600 pts Friday to finish January with its worst week since October losing over -3.2%. The S&P 500 and NASDAQ couldn't avoid a selloff, with both indexes losing -3.3% and -3.4%, respectively. The reason for the losses, a short squeeze of all short squeezes.

It started on January 25th when a group of retail investors identified Gamestop Corp (GME) as a buy on the WallStreetBets Reddit forum. This group of day traders continued to encourage each other to pile into GameStop's shares and call options, creating a massive short squeeze that inflicted pain for hedge funds betting against the stock. So much so that the trading app, Robinhood, seized trading mid-week of GME stock as well as several other stocks. After resuming trading Thursday, Robinhood has been limiting the number of shares that the retail investor can purchase.

All told, the short-selling hedge funds have suffered a loss of nearly 20 billion year to date, including a nearly $8 billion loss on Friday as the GME kept ripping higher. Still, short-sellers mostly are holding onto their bearish positions, or they are being replaced by new hedge funds willing to bet against the stock. GameStop shares that have been borrowed and sold short have declined by just about 5 million over the last week, marking an 8% dip in the short interest, according to S3. Most of the short-covering occurred on Thursday when the stock fell for the first time in six days, according to data from S3 Partners. Continue reading "Stock Market Feels The Squeeze"

U.S. Stock Market Rolls Lower

Stock market price action is usually conducted in a series of up and down price phases – or waves/cycles. Typically, price will move higher or lower in phases- attempting to trend upward or downward over time. This type of price action is normal. Extended upward trends with very little downward price retracements happen sometimes – but not often. They usually happen in “excess phase” rallies or after some type of news event changes expectations for a symbol/sector.

Putting Concerns Into Perspective – Still Bullish

Since early November 2020, the US stock market has continued to rally in a mode that is similar to an excess phase rally – showing very little signs of moderate price rotation. While price volatility has continued to stay higher than normal, you can see from the SPY Daily chart below that it has rallied from $324.40 to $385.95 (over 18%) in just under 90 days. At some point in the future, a moderate price rotation/retracement will happen that may be in excess of 6% to 11% – as has happened in the past.

Stock Market

The purpose of this research post is to alert readers that the markets appear to have started a period of downside price rotation – which is normal. This SPY Daily chart, above, highlights the upward support channel originating from the March 21, 2020, COVID-19 lows (CYAN line) and also the upward support channel originating from the early November 2020 lows (YELLOW line). Continue reading "U.S. Stock Market Rolls Lower"