Charting The Energies Data Release

Robert Boslego - INO.com Contributor - Energies


Each week, the Energy Information Administration (EIA) reports estimates for crude oil and petroleum products. These supply, demand and inventory estimates are used by traders to assess the inventory surplus (or deficit), the supply-demand balance and whether the market is tightening or not. The best measure of the latter is to look at the crude stock change and petroleum product stock change graphs.

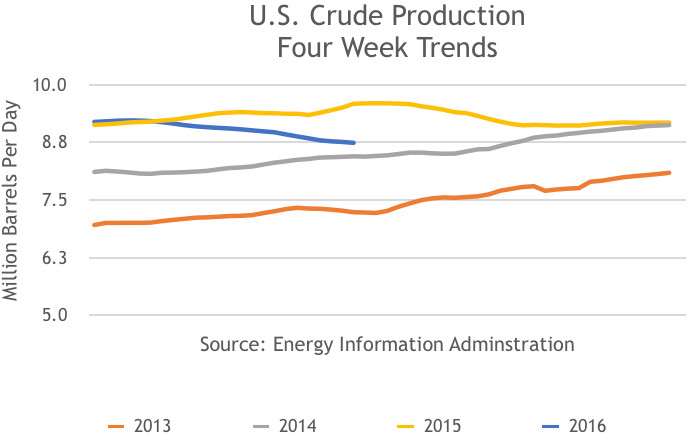
These stocks and trends are best understood in perspective and so comparisons are made to previous years. Interpreting the data reported by the EIA might otherwise be difficult or time-consuming.

It is important to note that these estimates are provided from surveys and EIA models and are subject to revision. The EIA crude production data, in particular, has been revised substantially in monthly data released a few months after the weeklies.

US Crude Production, 4 Week Trend, 2013, 2014, 2015, 2016

Other US Supply Four Week Trends, 2013, 2014, 2015, 2016

US Crude Production and Other Supply, 4 Week Trend, 2013, 2014, 2015, 2016

US Net Crude Imports, 4 Week Trend, 2013, 2014, 2015, 2016


Continue reading "Charting The Energies Data Release"

George Soros Making Big Bets on Gold

George Soros has joined fellow billionaire investors Stan Druckenmiller and Ray Dalios on investing big in gold. Precious metals expert Michael Ballanger explains what is behind these moves.

This week George Soros once again came out with his very large directional "bets" for the SP 500 and for gold and, needless to say, Mr. Soros is once again shorting the SP and buying gold and gold miners, joining Ray Dalio, Stanley Druckenmiller and Michael Ballanger (just kidding) in a decidedly unpopular stance. Carl Icahn came out in agreement during a CNBC interview this week that left the interviewer near-speechless and groveling in the mud of anti-Wall Street rhetoric.

In the meantime, some of the smartest investors I know are SOOOO bullish on gold that they are buying huge baskets of penny explorers under a nickel because of the leverage contained when the public finally decides to re-allocate to include gold (and mining stocks). A fund manager I know said to me, "Must be the top!" in reference to this, but it really can't be the top after a five-month rally representing the largest recorded quarterly advance in mining shares since recordkeeping began.

Look at the chart above and think what would happen if we were to get a shift from bonds to gold; 49% of global asset allocations reside in bonds while 1% reside in gold. Now, consider these two facts: Continue reading "George Soros Making Big Bets on Gold"

What's Up With Pfizer And Gold

Hello MarketClub members everywhere!

Having been born and raised in Great Britain, I occasionally look at the British newspapers for a different viewpoint on world events. I was recently surveying some of the British newspapers for news on Brexit when I came across an interesting article on research that is being done in Great Britain on Pfizer's famous blue pill.

MarketClub's Mid-day Market Report

Pfizer Inc. (NYSE:PFE): The drug Viagra could soon be used to treat hundreds of thousands of heart failure patients and even prevent fatal heart attacks, say scientists. Continue reading "What's Up With Pfizer And Gold"

Surfing The Market's Elliott Waves Post-Fed

The Fed is completely chickening out from raising rates and all related markets are on the move. Let's dive into our options trade on the gold miners and show you where I think we're headed next.

Learn more about TradingAnalysis.com here.

Plan Your Trade, and Trade Your Plan,
Todd Gordon

Gold Vs. S&P 500: Fly To Safety?

Aibek Burabayev - INO.com Contributor - Metals


Chart 1. Gold Vs. S&P 500: Saucer Reversal Pattern

Gold Vs. S&P 500: Saucer Reversal Pattern
Chart courtesy of tradingview.com

The Gold/S&P 500 ratio made a new high this past February breaking above both the August 2015 and October 2014 maximums. It has finally managed to surpass the depressing red resistance. The break was strong and violent pushing the ratio from 0.51 low to 0.68 high. After it runs out of steam we always witness a pullback ( the market digests the price action), the ratio returned to the point of the break at the end of May and now is starting the next round up.

This is a very healthy market move as the price pulled back, but hasn’t broken below the starting point. The first higher high and higher lower are in place now. Once we get a new higher high, we can draw an uptrend with confirmed touch points. Continue reading "Gold Vs. S&P 500: Fly To Safety?"