Chart of The Week - Corn to Move Higher

By: Chris Wilkinson of Longleaftrading.com

Corn has been in an upward trend since it put in its lows at the beginning of October. From there the chart has traded a series of measured Fibonacci levels all the way into profit targets each time. Last week's correction brings us right at the next Fibonacci sequence to take a long position and stick with this trend.

For a review of the previous Fibonacci sequence that traded into profit targets we draw the Fib tool from the lows of November 19th (362.5) up to November 28th highs (393.75). With this drawn you can see the market pulled back and found support right on the 50% level and traded directly into its first and second profit targets, the -23.6% Fib level and the -61.8% Fib level. See the Chart below.

4 Hour Chart Corn

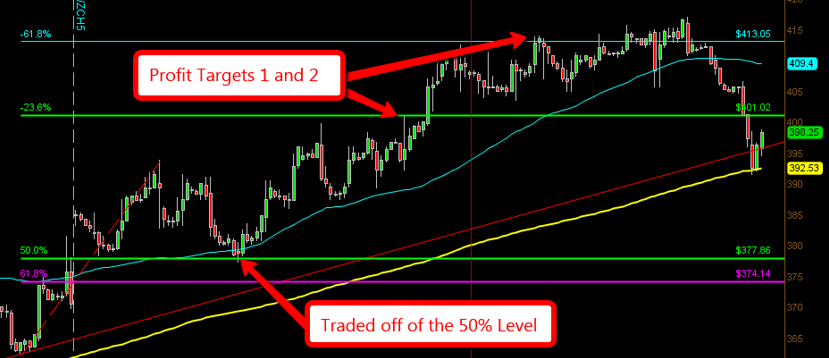
Now that the previous move has corrected we continue to draw the next series until we get to one that fails the 61.8% level. A failure happens when we get a strong close on a large time candle. An hourly close or higher is sufficient to call it a failure. Normally smaller time frames will trade back and forth around those levels so I look to larger time frames for confirmation. If a failure happens it is assumed the trend is over and the next one begins in the opposite direction.

The next move found by using the Fibonacci tool is drawn from the support of the previous move. We use the lows of December 3rd (377.25) and draw it all the way up to the new highs on December 29th (417). See Chart Below. Continue reading "Chart of The Week - Corn to Move Higher"

Chart For Profit: Buy Gold, Sell Euro

Aibek Burabayev - INO.com Contributor - Metals


Dear INO.com readers,

This week I prepared for you an analysis of gold versus the euro and why it might be profitable choice.

My last post was also dedicated to the European cross of gold versus the Swedish krona and, for the time being, it managed to gain more than 200 SEK per troy ounce (already or more than 2%). The target is set for a 14% gain, so please be patient.

Today I am going to tell you about a chance to score a nice 18%. The chart above is a monthly candle graph of XAUEUR for the last 5 years. It was me who wrongly forgot about such a liquid metal cross with such an interesting chart pattern being shaped. But fortunately, today we still have a chance to buy gold versus euro. Continue reading "Chart For Profit: Buy Gold, Sell Euro"

Gold Is Sending A Very Strong Message, Are You Listening?

Hello MarketClub members and friends of MarketClub everywhere! Today, I have a brief market update on the general market and an in-depth analysis on gold.

2015 has not started off too well for the US equity markets, while the reverse seems to be true for the action in gold (FOREX:XAUUSDO). What's going on? Oil continues to slip, which most economists thought would be good for the economy, but it does not seem to be helping the market. This brings me to my next thought...

Do you know about the "January Barometer"? Since World War II, if the market closes down in January, the average price change was usually flat in the remaining 11 months. So while certain stocks may do very well overall if the market closes down this month, look for a less than stellar year.

As you can see, while stocks have been swooning, gold has actually been on the move to the upside. As I write this, gold is up almost 3% and we are only 6 days into January!

Take a look at the chart and you can see that gold has almost completed an important technical formation known as a "head and shoulders bottom", one of the most reliable formations in your technical arsenal.

A higher close today clearly breaks over the the all important "neckline" resistance level. Once over the "neckline," I can see gold moving based on the head-to-neckline measurement up to the $1,330 to $1,340 level.

Wishing you all the very best in 2015.

Every success with MarketClub,
Adam Hewison
President, INO.com
Co-Creator, MarketClub

Investing During the Era of Peak Gold Discoveries

The Gold Report: Brent, you've quoted Goldcorp Inc.'s (G:TSX; GG:NYSE) CEO, Charles Jeannes, saying that we've reached peak economic gold production. What led us to this point?

Brent Cook: That's a big question that really goes back to what was happening in the global exploration sector 20+ years ago. I don't want to get into the peak gold production idea but instead focus on the discovery curve and what's behind the problem we are seeing in the gold sector.

Why aren't we finding as many gold deposits as we used to, or at least as many economic deposits? In 1995 or so, the discovery boom in the gold sector peaked and that success is largely tied to the opening of large areas of earth that were previously off limits to serious exploration. Since then, exploration success and new discoveries have trended down. However, in terms of gold production, it's taken about 20 years for all those discoveries to work their way through the system to come into full production.

So what Charles Jeannes sees is that in 2015 or so, gold production is going to be tapering off as opposed to expanding. That's especially true given the current gold price and cost structure. A lot of these companies aren't making much money, or any money at all. They'll be shutting down loss-making projects over the coming years.

TGR: Are we running out of gold in the world, or did we just not make an investment in a timely manner, say, 20 years ago? Continue reading "Investing During the Era of Peak Gold Discoveries"

Best 2015 Bond Bet: Long U.S. Treasuries

George Yacik - INO.com Contributor - Fed & Interest Rates


Readers of my most recent columns know that I’ve been very critical of the Federal Reserve’s sluggishness – if not actual lack of resolve – to start raising short-term interest rates now that the economy has finally started to show some staying power. The earliest projections, both from Fed officials and market prognosticators, is that the first rate hike won’t come until well after the end of the first quarter of this year, if not sometime in the second half.

But even if the Fed should start taking my advice and start raising rates sooner – it looks like the March 17-18 FOMC meeting would be the earliest – don’t draw the conclusion that I also think long-term interest rates are headed any higher anytime soon.

If anything, I think long-term rates are headed lower in 2015, meaning I think this year will be another good year for bonds, U.S. Treasuries specifically.

That makes me a bit of a contrarian, which is usually where I feel most comfortable anyway. Continue reading "Best 2015 Bond Bet: Long U.S. Treasuries"