The Time Machine is the dream of many (especially those who bet on sports) and I’m excited to see if we will be able to travel through time shortly as physics scientists confirmed that it is possible. In the meantime, we could profit or at least be prepared for the future using the market’s time machine.
Last week a textbook example of a “Flash Crash” occurred in the silver market when the price dropped almost 2 dollars (10%) within a minute! It’s amazing that gold was untouched by this event creating an arbitrage opportunity as all discrepancies are subject to speculative trading. That’s why I put the silver analysis first this time to show the map for a possible gold move. By the way, it is quite often that silver is the principal instrument for market movement as it has less liquidity and therefore more opportunities for market “gangsters” or “pirates” to attack it.
Chart 1. Silver Daily
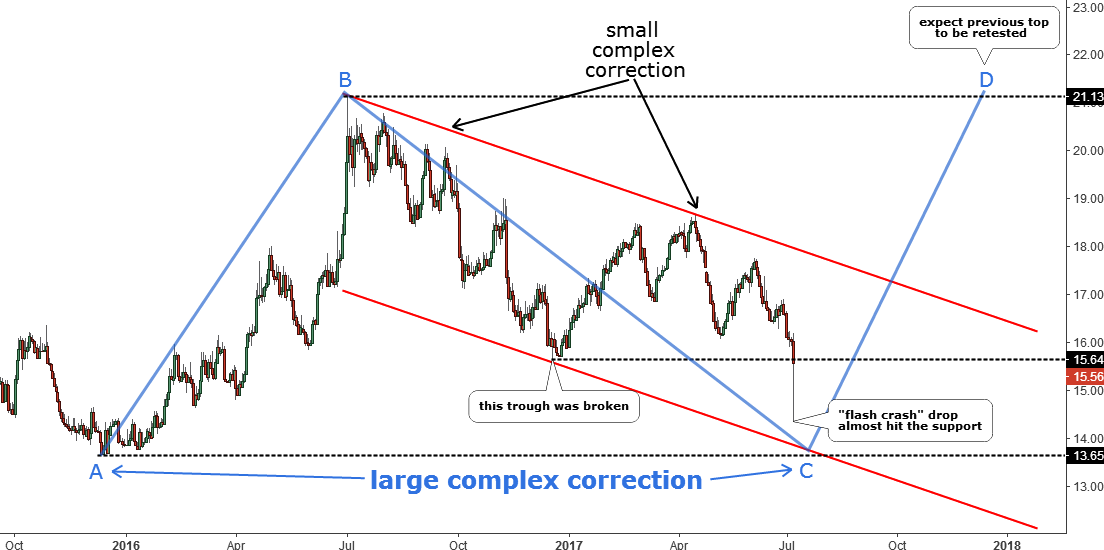
Chart courtesy of tradingview.com
After silver breached the previous major low established last December at the $15.64 mark the map has changed. What was tagged as a first move up turned out to be a tiny countertrend conjunctive move within the small complex correction contoured with the red downtrend. The Flash Crash drop almost reached the downside of the red channel, which could finish that small complex correction. Continue reading "Gold & Silver: Time Machine"