Crude Oil Rises Alongside Stocks

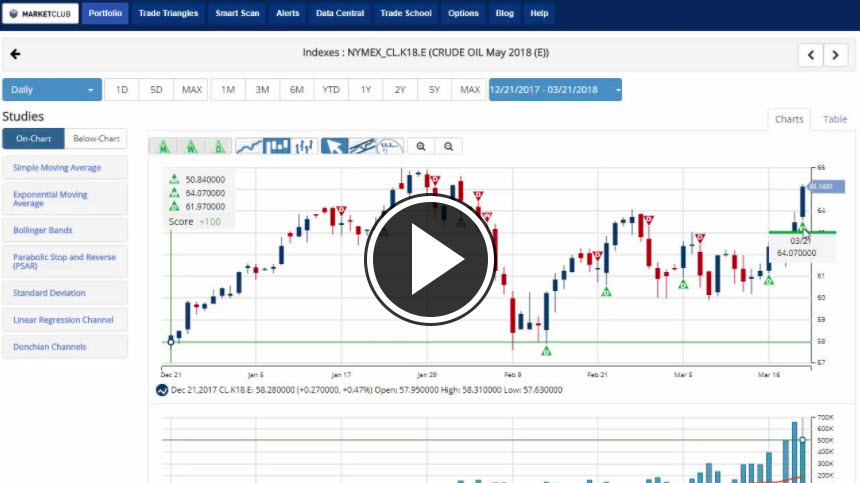
Hello traders everywhere. Crude oil climbed to its highest level in six weeks, a 2.6% gain to $65, after inventories in the U.S. dropped for the first time in a month, catching traders many off guard.

Refiners and brokers pulled more than 2.6 million barrels of crude from American storage facilities last week as many analyst and traders were expecting an increase. The withdrawal occurred amid speculation that the U.S. may intensify sanctions against Iran, OPEC's third-largest supplier.

Check our Robert Boselgo's updated 2018 crude oil outlook that we posted this morning.

Crude Oil Rises

The stock market is anxiously awaiting Fed Chairman Jerome Powell's news conference this afternoon at 2 pm where it is widely expected that he'll announce a rate hike after wrapping up the FOMC's two-day meeting. The expectation is for a 25 basis-point bump in rates.

Investors will also look for clues about the Fed's tightening trajectory for the rest of 2018.

Key Levels To Watch This Week:

Continue reading "Crude Oil Rises Alongside Stocks"

Updated 2018 Crude Oil Outlook

Robert Boslego - INO.com Contributor - Energies - Crude Oil Outlook


Analysis prepared on March 19, 2018

The relative rate of growth in supply v. demand will ultimately determine stock levels and prices. And the three key predicting agencies, the International Energy Agency (IEA), Energy Information Administration (EIA), and OPEC have different views on what is likely to unfold.

OPEC does not often predict is own production, but in December it forecast it would average 33.2 million barrels per day (mmbd) during 2018. That would far exceed its projected “call on OPEC oil,” which is world demand minus non-OPEC production. For 2018 as a whole, it predicts that figure will be 33.1 mmbd.

That demand for OPEC oil is based on a gain in demand of 1.52 mmbd and a rise in no-OPEC production of 1.15 mmbd. In my view demand is likely to be a bit stronger due to world economic growth. However, the non-OPEC supply number is much too low, given the recent rise in U.S. production of 886,000 b/d from August through November. (December production was down a bit for seasonal reasons.) Furthermore, U.S. production has yet to respond to $60/b. The rise in output last autumn was a response to $50/b.

The EIA has the most aggressive non-OPEC production estimate of a gain of 2.5 mmbd, with 2.0 occurring in the U.S. alone, and the balance in Canada and Brazil. The EIA forecast is based on a gain in crude production of 1.5 mmbd and a rise in other liquids of 500,000 b/d. WTI did not exceed $60 in any month since 2015 until January 2018. And the year-over-year gain in March 2018 is estimated to be 1.29 mmbd. And so the industry’s response to $60/b could very well enable the 1.5 mmbd gain. Continue reading "Updated 2018 Crude Oil Outlook"

More Spots Added - Options Webinar and Q&A

10-Minute Options Strategy - Live Webinar and Q&A
Thursday, March 22, 2018 at 3pm EDT

Huge apologizes to everyone who received a "webinar is full" message when they tried to register for the options webinar. There was such a great response that I had to up our registration cap.
Options Webinar

In this webinar, learn how to find, place, and manage profitable options trades in only 10 minutes with a simple strategy that I created.

Reserve Your Spot - although spots have been added, we are on pace to hit max capacity.

Can't make it? Please register for the event, and you'll receive a recording of the webinar.

Thank you,
Trader Travis
MarketClub Options

Facebook Data Woes Pull Down Tech Sector

Hello traders everywhere. Facebook's decline of over 7% today has put pressure on the entire stock market, especially the tech sector. Facebook fell after reports surfaced that the political analytics firm Cambridge Analytica was able to collect data on 50 million people's profiles without their consent. It begs the question, should the likes of Facebook, Twitter, and Snap be under some form of federal regulation?

This drop by Facebook is the most significant drop in its stock price in 16 months. The fall is more than 10% below its all-time high set on Feb. 1 and it also pushed the price below its 50-day and 200-day moving averages, two key technical levels.

Facebook

Key Events On Tap This Week:

The Fed decision and Powell's news conference come on Wednesday.

The Bank of England is expected to keep interest rates and its asset-purchase program unchanged on Thursday. Attention will be on language and the odds for a May hike.

Saudi Crown Prince Mohammed bin Salman is expected to meet with President Donald Trump at the White House this week as part of a U.S. visit.

Company earnings scheduled for this week include Tencent, FedEx, Porsche, Hermes, PetroChina, Nike, Enel, and Oracle.

Key Levels To Watch This Week:

Continue reading "Facebook Data Woes Pull Down Tech Sector"

Weekly Futures Recap With Mike Seery

We've asked Michael Seery of SEERYFUTURES.COM to give our INO readers a weekly recap of the Futures market. He has been Senior Analyst for close to 15 years and has extensive knowledge of all of the commodity and option markets.

Michael frequently appears on multiple business networks including Bloomberg news, Fox Business, CNBC Worldwide, CNN Business, and Bloomberg TV. He is also a guest on First Business, which is a national and internationally syndicated business show.

Gold Futures

Gold futures in the April contract settled last Friday in New York at 1,324 an ounce while currently trading at 1,317 down about $7 for the trading week near a two week low. I'm not involved in this commodity, however, I am looking for a possible short position in next week's trade once the chart structure improves. In my opinion gold prices could retest the March 1st low of around 1,303 as we are now trading under their 20-day moving average, but still above their 100-day moving average as this market remains choppy to sideways in the short-term. The U.S dollar looks to have bottomed out and that would be a negative towards the precious metals as silver remains very weak as well as the commodities, in general, have turned negative due to the Trump tariffs which are rattling the markets as we are worried about repercussions coming out of China sending prices lower. Volatility in gold remains relatively low as a double top looks to have been created around the 1,365 level so look to play this to the downside. I think the path of least resistance is to the downside, but wait for the risk/reward to become in your favor; however, I am certainly not recommending a bullish position.
TREND: MIXED
CHART STRUCTURE: IMPROVING
VOLATILITY:INCREASING

Continue reading "Weekly Futures Recap With Mike Seery"