Old friends and new guests, thank you very much for the comments and discussions regarding my post last week. One thing was clear… you prefer classic trend line charts! I will try to keep it short and simple from now and on. I will keep Elliott Wave for more liquid and crowd trending markets, like stocks and indices, where they work better.
Gold
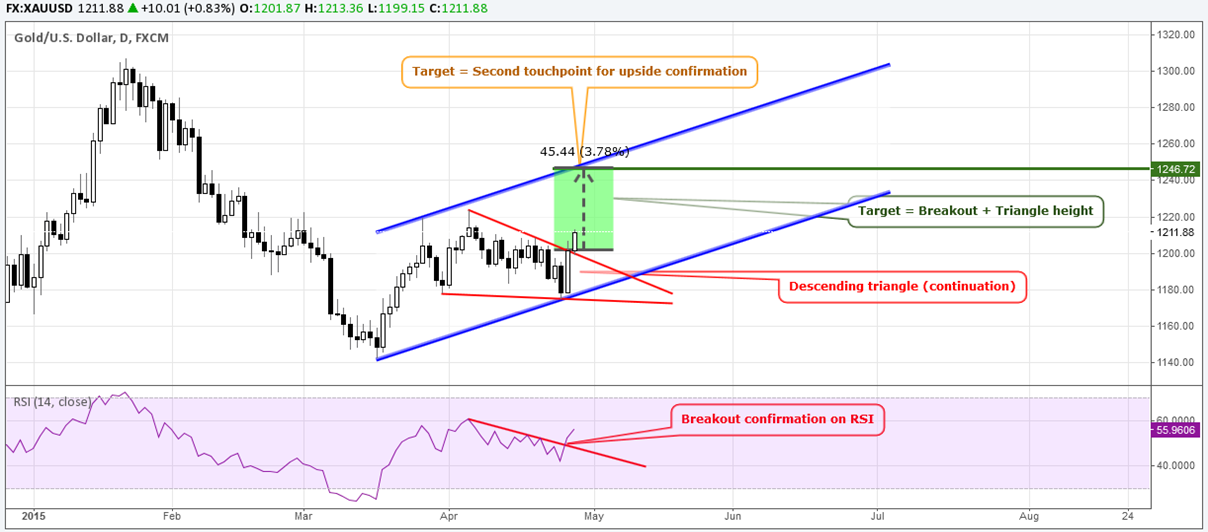
Chart courtesy of Tradingview.com
Last week Gold was very tricky compared to the other Dollar rivals. For example, the Euro and Crude oil are creeping up, while Gold did the opposite and squeezed out buyers. Yesterday, sellers couldn't escape either and got stopped out.
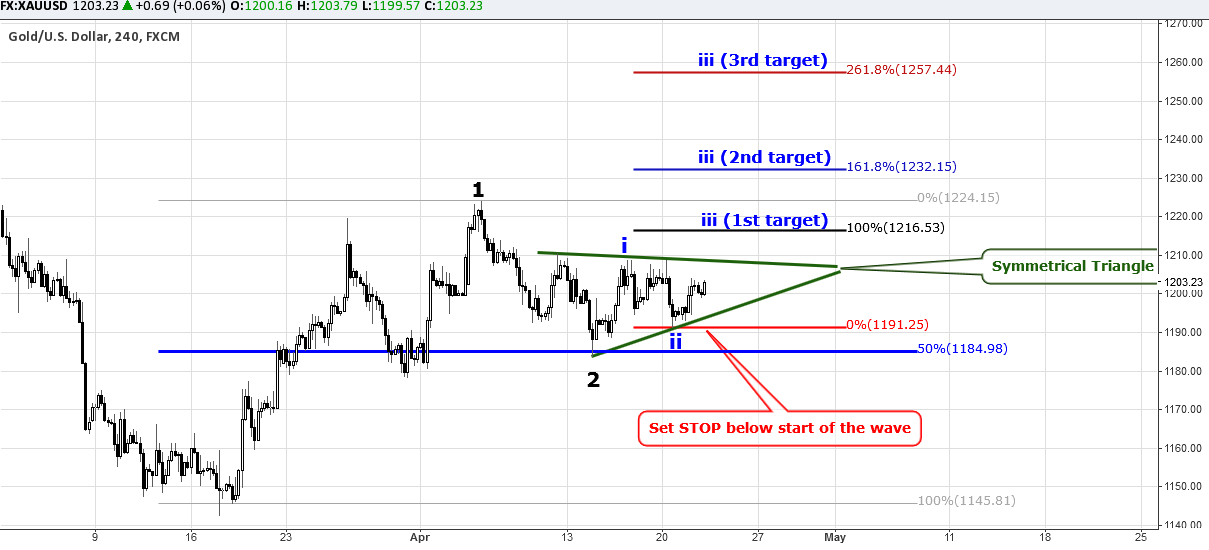
The price touched the downside for the second time and Gold shaped the Descending Triangle pattern which is highlighted in red. A breakout happened today above $1200. It means that we will watch the continuation of an uptrend (highlighted in blue). The target is calculated as a sum of the breakout and the height of the Triangle, which is located at $1246 area. Continue reading "Gold And Silver: Just K.I.S.S!"