Options-Based Portfolio: 50% Cash and Matching S&P 500 Returns

2019 shaped up to be a historic year for the stock market indices. The S&P 500 posted its fourth-best annual return in over 20 years, coming in at a ~29.5% return (my options-based portfolio has generated the same returns). Only two other years have outpaced these 2019 returns. These occurred in 1995 and 1997, posting returns of 34.1% and 31.0%, respectively. 2019 was a unique year on multiple fronts, most notably because the market returns outpaced even the most bullish forecast by any Wall Street analyst. The markets roared higher in the face of impeachment proceedings, U.S.-China trade war, Federal Reserve actions, inverted yield curve, and slowing economies abroad. Furthermore, for the first time in history, the U.S. economy has started and ended a decade without a recession, with the economy expanding for a record 126 consecutive months (Figure 1).

Options-Based Portfolio
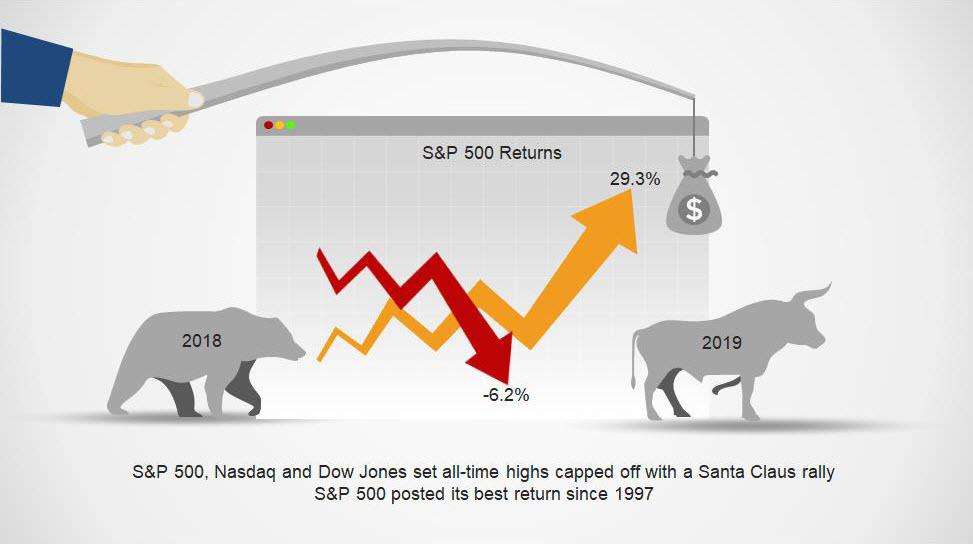
Figure 1 – S&P 500, Nasdaq, and Dow Jones all set all-time highs as 2019 came to a close. The markets are in rarified territory with stretched valuations absent of any volatility. The Santa Claus rally capped off a euphoric market, generating the best returns in over 20 years

A data-driven, options-based portfolio sells options and collects premium income in a high-probability manner to generate consistent income for steady portfolio appreciation. This strategy mitigates risk and circumvents drastic market moves and is done without predicting which way the markets will move. Options are a great way to generate superior returns with less volatility in both bear and bull market conditions over the long term. Despite my 2019 performance lagging the S&P 500, the options-based strategy has generated the same returns when factoring in the Q4 2018 market sell-off. As 2019 comes to a close, my options-based portfolio returned ~19% relative to the S&P 500 return of 29.5%. Despite the epic 2019 market, when including the market sell-off of Q4 2018, my options-based portfolio has returned 11.6% relative to the S&P 500 return of 11.2%. I was able to achieve the same market performance over the past 15 months with my current cash position at ~50% of my portfolio. Continue reading "Options-Based Portfolio: 50% Cash and Matching S&P 500 Returns"

Stocks Fall After U.S. Airstrike

Hello traders everywhere. A day after setting new record highs, the major indexes and overall stock market are barely hanging on to weekly gains to start the new year. The U.S. confirmed that an airstrike killed Iran's top military commander, sending oil prices surging and hiking geopolitical concerns.

The DOW plunged 360 points at the open only to bounce back and trade roughly 175 points lower on the day hanging on to a weekly gain of +.16%. The S&P 500 is close to finishing the week in negative territory with a small gain of +.10% while the NASDAQ has a little more wiggle room with an increase of +.50%

On Thursday, the DOW advanced 330.36 points +0.9% to 28,868.80 and notched its biggest one-day gain since Dec. 6. The S&P 500 closed +0.8% higher, marking its best performance since Dec. 12 at 3,257.85. The NASDAQ gained +1.3% to end at 9,092.19 and had it's best day since Oct. 11. The major averages hit their session highs in the final minutes of trading. Continue reading "Stocks Fall After U.S. Airstrike"

Top 25 ETFs To Have Owned Over The Last Decade

The table below is a list of the 25-top performing ETFs over the last ten years. As you will see, the majority of the Exchange Traded Funds on this list produced returns of 15% or more on an annualized basis, with the top ETF returning more than 19% a year on average over the past decade. That would equate to roughly a 250% return before any dividends or fees.

ETFs
Continue reading "Top 25 ETFs To Have Owned Over The Last Decade"

Top Currencies VS. Gold In 2019: Last Man Standing

It’s time to find out in this traditional yearly post if there were any currencies that could beat the mighty gold this year.

7 currencies represent the fiat money: US dollar (USD) and 6 components of the US dollar index (DXY) placed by weight: euro (EUR), Japanese yen (JPY), British pound (GBP), Canadian dollar (CAD), Swedish krona (SEK) and the Swiss franc (CHF). This time I added the Bitcoin from the crypto-world.

Before we get down to the results of 2019, let us see below how you forecasted the future back at the end of December 2018.

LLLL

The majority of you again, as last year, bet that the primary currency (USD) would defeat all other rivals to come out on top in 2019. The readers’ geography played a crucial role here. The second choice was the Japanese yen; I guess it was selected as it topped the chart last year.

Bitcoin ranked the third; it was the top loser last year. It looks like some readers watch my Pendulum experiments closely.

Let’s look at the diagram below to find out the results. Continue reading "Top Currencies VS. Gold In 2019: Last Man Standing"