Gold & Silver: Silver Has Ace In The Hole

Aibek Burabayev - INO.com Contributor - Metals


Everything in our world consists of uncountable invisible parts. It looks like a Great Constructor builds everything thoroughly copying and pasting the smallest parts of every single thing connecting it into something big and meaningful let it be living or non-living things.

And so are the market trends as they consist of the smallest tick trends, which are invisible on higher time frames. But when these ticks are built stable into one direction it makes a megatrend like the house is being built of small bricks. Top metals are now building an uptrend, which consists of smaller ones which I would like to highlight for you today in updated daily charts below. Continue reading "Gold & Silver: Silver Has Ace In The Hole"

Copper's Consolidation Offers Buying Opportunity for Freeport-McMoRan

Aibek Burabayev - INO.com Contributor - Metals


Every great party is followed by a hangover; every good rally is followed by a consolidation.

Chart 1. Copper Weekly: Consolidation

Weekly Copper Chart
Chart courtesy of tradingview.com

Copper was a hit at the end of last year. The price has gained more than 30% at the top of $2.74 from the end of last October. And then the players started to book the profit pushing the price down to the $2.4 area. It’s wise and natural to save such an incredible gain. Continue reading "Copper's Consolidation Offers Buying Opportunity for Freeport-McMoRan"

Gold & Silver: Reversed! What's Next?

Aibek Burabayev - INO.com Contributor - Metals


It’s ironic that people often get puzzled when they get what they wanted or dreamt about. Those who had dreamt of having a baby often panic when the baby is born and think what should we do with this cute toddler?

We are now in the same situation. I called for market a reversal last month and now we got it! Hmm…what’s next? Now that my prediction raised a ton of money I need to carry on using chart analysis only.

Chart 1. Gold Daily: The Santa Claus Rally!

Daily Gold Chart
Chart courtesy of tradingview.com

It was not easy at all for gold to escape from captivity of the blue downtrend. I extended it on the chart above to cover the whole move down as in the previous chart it was half as short as such deep was this move. Continue reading "Gold & Silver: Reversed! What's Next?"

Gold & Silver: Silver Is The First Up

Aibek Burabayev - INO.com Contributor - Metals


Those who hope tell themselves - one day the tide will turn. I think a lot of people are either long or they’re not and were waiting for the rise of the top metals. Below are fresh charts which could help us to understand where we are and when the tide will turn higher.

Chart 1. Gold Daily: Watch The Breakup For Reversal

Daily Gold Chart W/RSI
Chart courtesy of tradingview.com

I’ve written quite a lot in my previous posts about the tricky nature of corrective structures which have unpredictable outcomes. But the more time we spend inside of it, the higher are the chances that the situation becomes clearer. Continue reading "Gold & Silver: Silver Is The First Up"

With All Eyes On Equities - You May Have Missed This Sleeper

Call it the Trump Rally, or any name you like, but the stock market certainly came alive when the election swung in Donald Trump's favor. While all eyes are on equities, other things are going on in other markets that you should be preparing for.

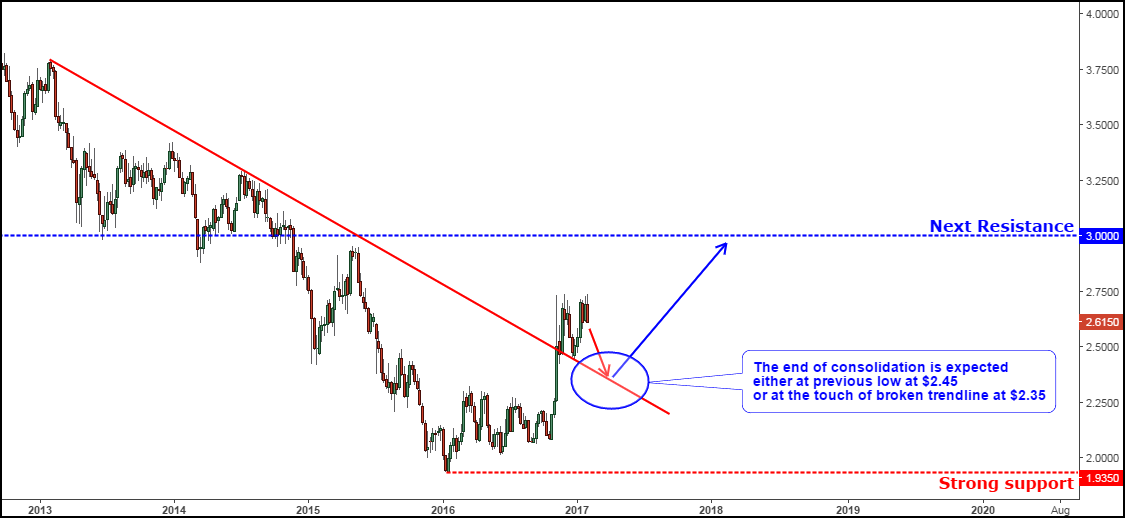
Today, I'm going to take an in-depth look at the gold market that has been out of favor the last several years. Gold (FOREX:XAUUSDO) did enjoy a strong rally in the first half of the year and was a top performer. Since moving close to $1400 in July, gold has steadily eroded down to around the $1,180. The question now is, is gold going to continue on the downside or begin to stabilize and start looking forward to what could be an inflationary future? With that in mind, I decided to look at three market keys that could unlock gold and determine its future.

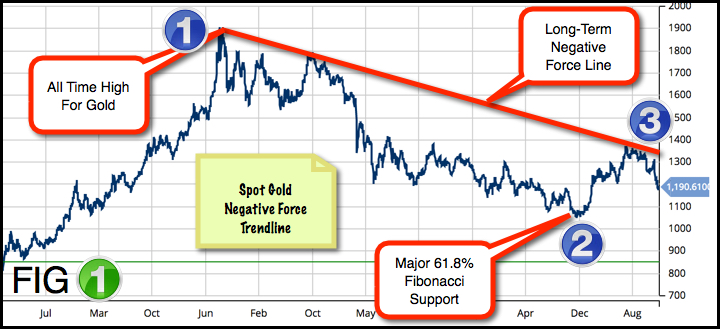
Long-Term Negative Force Line

FIG 1. I have drawn a long-term down sloping trendline starting from gold's all-time high of around $1900 and connected it to several other high points over the years. To be a valid technical trendline, it must touch three points. When that happens, it confirms the validity of the line. The long-term negative force line seen in FIG 1 is the dominant and number one element that will determine which way gold is headed in the future. I would consider a move over the $1375 - $1400 (3) levels on spot gold as a major signal that gold has changed direction to the upside. When this happens, and it will happen sometime in the future, gold will enter into a multiyear bull market. FIG 1 is the number one technical aspect for gold and should be watched closely in 2017.

Gold (FOREX:XAUUSDO) Trendline

Continue reading "With All Eyes On Equities - You May Have Missed This Sleeper"