Gold & Silver: Too Good To Be True?

The prices of gold and silver remained between triggers last week as volatility left the market, and the “pulse” on the chart is hardly beating. It is time to challenge our bullish view, as it could be “too good to be true.”

Let us imagine if the market is building a more complex correction and another downward move is underway. I put that scenario in the alternative charts for gold and silver below. Before we jump in precious metals, I would like to share with you an updated US dollar index (DXY) 4-hour chart.

dollar

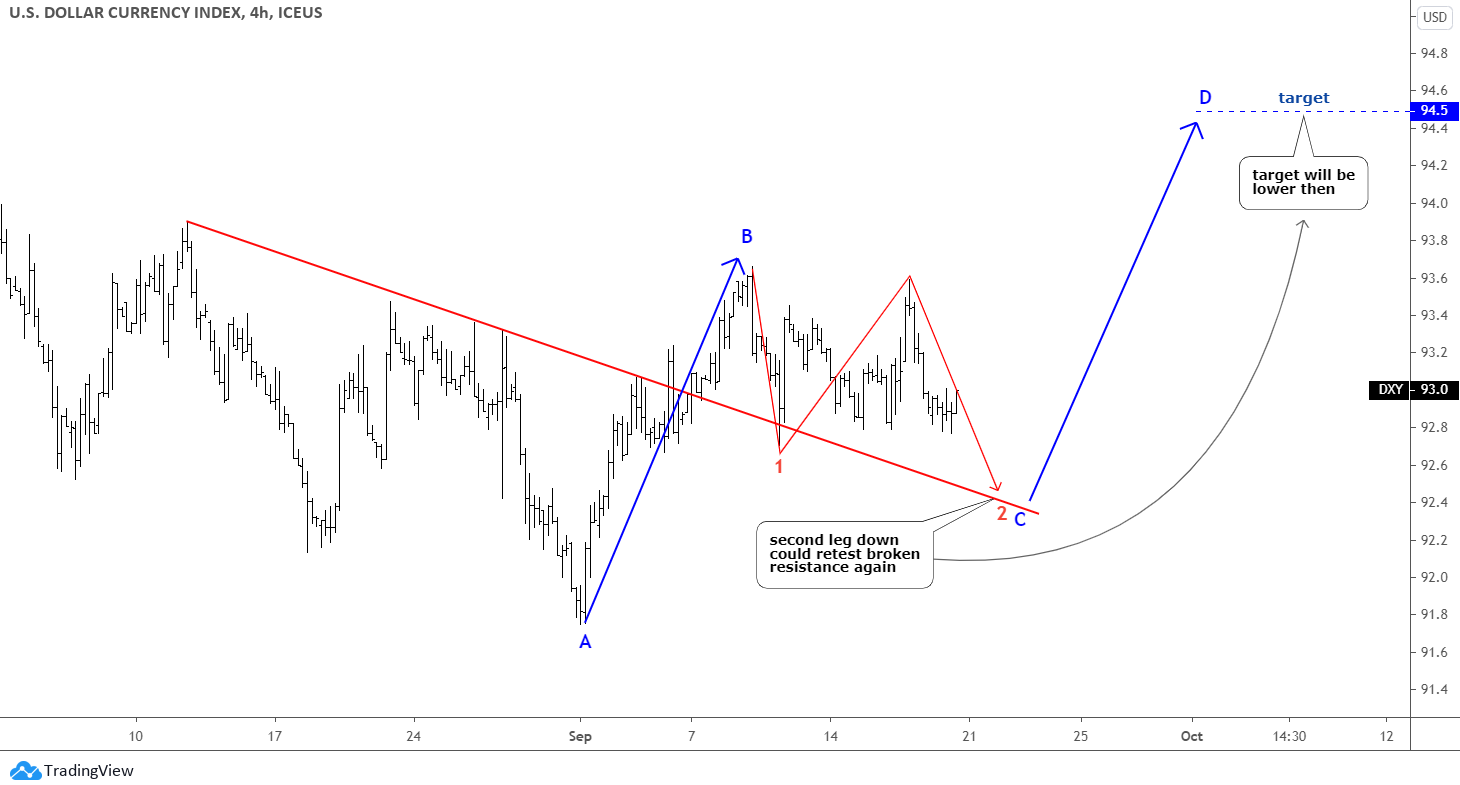
The DXY goes very well with my expectations as the outlined structure keeps intact, and we got a larger consolidation here with a second leg down underway. It could dip even lower to retest the former resistance again in 92.4 area. That will cut the target for the pending CD segment either to 94.5 from the earlier aim of 94.6. Continue reading "Gold & Silver: Too Good To Be True?"

Improving Global Demand Drives Futures Higher

Copper Futures

Copper futures in the December contract settled last Friday in New York at 3.0395 a pound while currently trading at 3.0700, up about 300 points for the trading week as prices are still right near a 2 year high.

I have been recommending a bullish position from around the 3.0140 level, and if you took that trade, continue to place the stop loss under the 10-day low, which stands at 2.9555. However, the chart structure will improve in 4 trading sessions; therefore, the monetary risk will be reduced. I also have a bullish platinum recommendation out of the precious metals. I think commodities are headed higher across-the-board due to strengthening demand improving worldwide. I will be looking at adding more contracts to the upside as the risk/reward remain in your favor because prices have gone nowhere over the last 3 weeks as. That situation is not going to last much longer as a breakout is looming, in my opinion.

Copper prices are trading far above their 20 and 100-day moving average as this trend is strong to the upside as fundamentally speaking, strong demand continues to propel prices higher.

TREND: HIGHER
CHART STRUCTURE: EXCELLENT
VOLATILITY: AVERAGE

Coffee Futures

Coffee futures in the December contract settled last Friday in New York at 132.45 a pound while currently trading at 113.90, down over 1800 points for the trading week as prices have now hit a 4 week low.

I do not have any soft commodity recommendations; however, I believe the multi-decade low that was hit on June 15th at 96.90 will hold as I will be looking at a bullish trade in the coming days ahead. The risk would be around $7,000, which is way too much, so be patient. I think a bottom has been formed, but the rain has come back into key coffee growing regions in Brazil, which has sent prices sharply lower here in the short-term. Continue reading "Improving Global Demand Drives Futures Higher"

Do We Really Need More Stimulus?

As we speak, Republicans and Democrats are still wrestling over another coronavirus stimulus package. Everyone wants one, we’re told, and the economy needs one.

Don’t start spending that stimulus check just yet.

Despite what they claim, Democrats don’t really want a deal, no matter how big, at least not until after the election. Do you really believe that Nancy Pelosi and Chuck Schumer want to allow President Trump to play Santa Claus and send out $1,200 checks to American voters right before the election? Needless to say, the president would just love to have his name on those checks.

So don’t count on another stimulus package until after the election, if then. It’s a valid question of whether the country really needs another one. But never fear, the Federal Reserve will step in where Congress fears to tread.

At its September 15-16 monetary policy meeting – the last one before Election Day – the Fed updated and revised its prognosis upward for the U.S. economy, finally catching up with many other analysts and some of its own regional banks who are forecasting a much brighter picture than Fed Chair Jerome Powell and many other Fed officials have been painting over the past couple of months.

The Fed now expects U.S. economic growth to be negative 3.7% for this year, a big upgrade from its negative 6.5% projection in June. It also expects positive growth of 4.0% next year (down from 5.0%), 3.0% in 2022 and 2.5% in 2023. Regarding unemployment, it expects the jobless rate to fall to 7.6% this year from its June projection of 9.3%, declining further to 5.5% next year, 4.6% in 2022, and 4.0% – i.e., full employment – in 2023. Continue reading "Do We Really Need More Stimulus?"

September Blues Continue For Stocks

Historically speaking, September tends to be a weak month for the stock market. September has been the worst-performing month for markets, on average, since 1950, with the S&P 500 (SP500) dropping on average about -1% since 1950. And this September is no different as we prepare for the third week of trading. As we stand, the S&P 500 is down just a hair over -5% on the month, the DOW has lost -2.6%, and the NASDAQ has fared the worst with a loss standing at -8%. If we don't see a second-half rally, the stock market will post its first monthly loss in 5 months.

Will we see a late-month rally? Or are we headed lower?

On a daily level, both the S&P 500 and NASDAQ closed out Friday trading with losses over -1% with the S&P 500 losing -1.12%, and the NASDAQ lost -1.07%. The DOW fared slightly better, only losing -.88% after being down over -1% earlier in the day. Continue reading "September Blues Continue For Stocks"

This Is Why You Are Losing To The S&P 500

You recently looked at your very diversified portfolio and compared it to the return of the S&P 500 (SPY), and to your shock, you are underperforming the market. You start to wonder how that can be. You own quality companies and have held their own in 2020 if not even produced a nice return. You also own an excellent mixture of industries, whether it's through individual stock holdings or Exchange Traded Funds.

You are well diversified and have produced a good return over the years and stayed within the S&P 500. But now, all of a sudden, the market is bouncing your performance. Well, shockingly, this may not be because your portfolio isn't good. You haven't been diligent enough following along with your holding's performance and business strategies in the future.

It very well likely has nothing to do with something you may have or have not done. It is likely, the way the S&P 500 is structured and how your portfolio isn't structured.

The S&P 500 is structured by market capitalization. That means the largest companies from a market capitalization standpoint, in the S&P 500 carry more weight in the portfolio than companies that are smaller in terms of market capitalization.

For example, Apple (AAPL) is the largest company in the S&P 500, with a market capitalization of $2.13 trillion and has a 7.06% weighting in the S&P 500. The smallest company in the S&P 500 is Coty Inc. (COTY), which has a market capitalization of $2.83 billion and a weighting of 0.003679% in the S&P 500 index. Continue reading "This Is Why You Are Losing To The S&P 500"