Silver Begins Big Upside Rally Attempt

The move we saw in Silver early this week to new 6-year high price levels, above $22.60, is quite likely the biggest upside move in Silver since the bottom in March 2020 – after the US stock market collapsed because of the COVID-19 virus event. This new rally in Silver is likely the move we’ve been suggesting to our followers relating to a series of measured upside price moves totaling approximately $5.30 in each advance.

As traders, watching bonds accelerate moderately higher as the US Dollar falls and the stock market attempts new lofty levels, we are intrigued by the move in metals because it suggests a large segment of investors believe a bubble is nearing very peak valuation levels. The only reason metals, particularly Silver, would be accelerating as it has recently is that traders have suddenly adopted a stronger demand for second-stage hedging of risk.

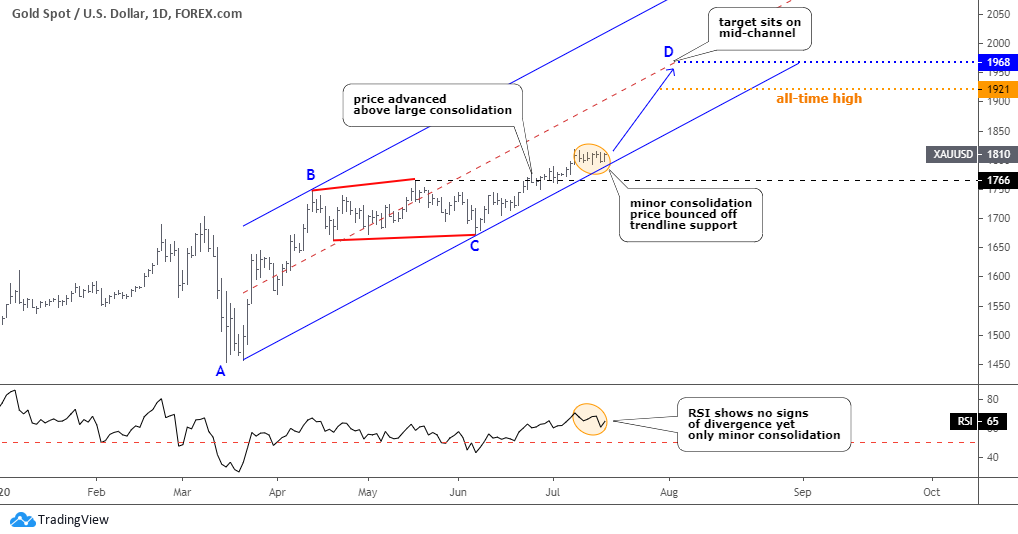
Gold is the traditional hedge for many traders in times of risk. Silver, being the second-tier hedge, typically start to rally 4 to 6+ months after Gold begins to move substantially higher. Gold is currently trading near all-time highs – near $1820. Silver just recently bottomed in March 2020 near $11.65 and has rallied more than 70% to current levels – above $20.35. If our research is correct, Silver will rally to levels above $26 within this current upside rally.

The multiple measured moves in Gold and Silver suggest waves of price advances happen in a series of structured upside price moves. We believe this current upside move in Silver will push price levels above $26 per ounce. If Gold continues to rally as Silver rallies, then future measured moves should target $31.50 and $36.75 in Silver – possibly higher. Continue reading "Silver Begins Big Upside Rally Attempt"

Options Trading - Custom Put Spreads

Leveraging a minimal amount of capital, mitigating risk, and maximizing returns is the objective of an options-based portfolio. Options trading can offer the optimal balance between risk and reward while providing a margin of downside protection with a high probability of success. Proper portfolio construction and optimal risk management are essential when engaging in options trading as a means to drive portfolio performance. Key pillars of risk mitigation are rooted in maintaining liquidity, risk-defining trades, staggering options expiration dates, trading across a wide array of uncorrelated tickers, maximizing the number of trades, appropriate position allocation, and selling options to collect premium income. Customizing your option trade structure is another element that can be layered into the overall strategy for long-term success in options trading. A risk-defined custom put spread offers layers of protection, thus optimizing the risk management aspect of an options trade while maximizing return on investment.

Custom Put Spreads: Results

Leveraging a minimal amount of capital and maximizing returns with risk-defined trades optimizes the risk-reward profile. Whether you have a small account or a large account, a defined risk (i.e., custom put spreads) strategy enables you to leverage a minimal amount of capital which opens the door to trading virtually any stock on the market regardless of share price such as Apple (AAPL), Amazon (AMZN), Chipotle (CMG), Facebook (FB), etc. Risk-defined options can easily yield double-digit realized gains over the course of a typical one month contract (Figures 1, 2, and 3).

Options Trading
Figure 1 – Average income per trade of $201, the average return per trade of 7.6% and 98% premium capture over 63 trades in May and June
Continue reading "Options Trading - Custom Put Spreads"

Gold And Silver Could Diverge

At the beginning of this month, I shared a warning alert as the silver chart had a Bearish divergence. The trigger was set below 50 on the RSI. It wasn’t activated, and gold and silver moved higher. Moreover, silver finally hits the target. The majority of readers kept a bullish outlook and got it right.

I prepared an update for you with the bonus chart at the end, so stay tuned.

Let’s start with the daily gold chart.

Gold Chart

Gold is slowly moving to the upside. It hasn’t shown any bearish signs as of yet. The metal finally elevated above the top of the preceding large consolidation beyond $1766 (black dashed line), eliminating the option of another leg down within an even more extended consolidation. Continue reading "Gold And Silver Could Diverge"

Silver Futures Hit New 10-Month High

Silver Futures

Silver futures in the September contract settled last Friday in New York at 19.05 an ounce while currently trading at 19.75 up $0.70 for the trading week as prices have now hit a 10-month high. The US dollar is lower by 35 points today, breaking the 96 level as that is a fundamental bullish factor towards the precious metals, including silver, as I think prices will break the $20 level come next week.

I have been recommending a bullish position over the last month from around the 18.61 level. If you took that trade continue to place the stop loss under the 10-day low standing at 18.23, however, in next week's trade, the stop loss will be tightened significantly, therefore lowering the monetary risk.

Silver prices are trading far above their 20 and 100-day moving average as the trend is strong to the upside as gold prices are right at a 9-year high. I also have a bullish recommendation in platinum, as the entire sector is in the midst of a solid trend to the upside. If prices crack the $20 level, look for the volatility to expand tremendously as the price swings will have a large percentage move daily. I still think we can head up to the $25/$30 level.

TREND: HIGHER
CHART STRUCTURE: IMPROVING
VOLATILITY: HIGH

Natural Gas Futures

Natural gas futures in the September contract settled last Friday in New York at 1.85 while currently trading at 1.78 down slightly for the trading week as prices are still near a multi-decade low. Prices topped out recently on June 7th around the 1.99 level while bottoming out on June 26th at 1.58 basically right in the middle part of that range looking for a fresh trend to the upside to develop, in my opinion. Continue reading "Silver Futures Hit New 10-Month High"

The Big Picture Continuum

The Continuum (monthly 30yr yield with the 100-month EMA ‘limiter’) simply states that the economy was weakening, as were inflation expectations, before 2020. In early 2020 we got a real deflationary jolt from which asset markets are still clawing back, with full frontal inflationary support from a Federal Reserve desperate to keep asset owners whole (and further enriched) and to further punish savers and those without the means to invest in the racket.

They called Ben Bernanke “the Hero” but he was actually the perpetrator of the next debt-backed inflation that would further ruin the country, primarily by greatly increasing the divide between asset owners and everyone else. If we had taken the pain in 2008 and 2009 we’d be on a new system now. Instead, we are riding the Greenspan>Bernanke>Powell continuum. Yellen is omitted because nothing egregious happened under her watch. She slipped in between the cycles and fell through the cracks.

Racism? Scapegoating? Xenophobia? Paranoia? Polarization? Caricature of the truth and of the debate? It’s all in there and it’s all in one way or another compliments of the rigged monetary system promoted by the Fed and whatever party happens to be in power at any given time (let’s remember that Bernanke’s ‘rich richer, poor poorer’ scheme was cooked up under a supposed socialist president). The public is filled with political bias and hatred but is relatively ignorant about where the wheels of injustice actually turn. Continue reading "The Big Picture Continuum"