Bitcoin Enters Long-Term Downtrend

Hello traders everywhere. Bitcoin has been due for a big move/breakout for a while now after being trapped in a trading range of $8,500 to $7,850 since the end of September. I fully expected the move to be to the downside as pressure was mounting from the 50-day and 200-day moving averages as they got closer and closer to crossing. Last week I had mentioned the coming "death cross," and while we haven't quite got that, we did get a new red monthly Trade Triangle at $7,714.70, signaling entry into the long-term downtrend.

Bitcoin is trading well below its 50-day and 200-day MA, the MACD is close to turning lower, and the MA's are closing in on that death cross. Right now, it appears that bitcoin has found support at the $7,430 level last hit in June of this year. If the 50-day can cross the 200-day look for a big move lower, the previous time the cross happened, Bitcoin rode the long-term downtrend to the $3,100 level.

Key Levels To Watch This Week:

Continue reading "Bitcoin Enters Long-Term Downtrend"

Revisiting "Black Monday - 1987" - Oct. 19, Part 1

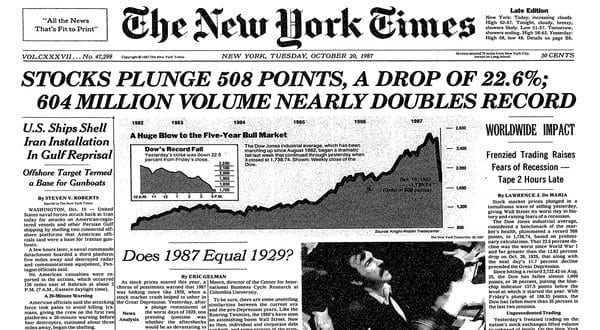
Back in the day, for those of you that are old enough to remember and have experienced one of the most incredible trader psychology driven stock market decline in recent history.

The difference between “Black Monday” and most of the other recent stock market declines is that October 19, 1987, was driven by a true psychological panic, what we consider true price exploration, after an incredible price rally.

It is different than the DOT COM (2001) decline and vastly different than the Credit Market Crisis (2008-09) because both of those events were related to true fundamental and technical evaluations. In both of those instances, prices have been rising for quite some time, but the underlying fundamentals of the economics of the markets collapsed and the markets collapsed with future expectations. Before we get too deep, be sure to opt-in to our free-market trend signals newsletter.

Our researchers believe the setup prior to the Black Monday collapse is strangely similar to the current setup across the global markets. In 1982, Ronald Reagan was elected into his second term as the US President. Since his election in 1980, the US stock market has risen over 300% by August 1987.

Reagan, much like President Trump, was elected after a long period of US economic malaise and ushered in an economic boom-cycle that really began to accelerate near August 1983 – near the end of his first term. The expansion from the lows of 1982, near 102.20, to the highs of 1987, near 337.90, in the S&P 500 prompted an incredible rally in the US markets for all global investors.

Black Monday

This is very similar to what has happened since 2015/16 in the markets and particularly after the November 2016 elections when the S&P500 bottomed near 1807.5 and has recently set hew highs near 3026.20 – a 67.4% price rally in just over 3 years. Continue reading "Revisiting "Black Monday - 1987" - Oct. 19, Part 1"

Palladium Reached Double Resistance

Back in March, I shared with you an updated chart for palladium. It hit the record high of $1553 by that time to become the most precious metal, and it still is.

Every time the price makes a record high, there is a chance for a reversal. In that post, I measured the AB/CD segments of the upside moves on the chart and both short term and long term measurements showed the equality, which meant the possible exhaustion of a Bull Run. I didn't try to guess the top that time and asked your opinion. Below is the distribution of your votes.

Palladium

Most voters chose the $1600-2000 range for the top of the palladium price, which meant that the established new record should be updated to the upside. Your prediction amazingly came true, but this bet wasn't that obvious as it played out only five months later, when the metal refreshed the all-time high at $1601 in July as only then the price entered the forecasted range. Last week the price did it once again to hit a new record high of $1750, confirming your accurate prophecy. Congratulations!

Let's see what happens with the palladium futures these days in the weekly chart below. Continue reading "Palladium Reached Double Resistance"

The Gold Stock Correction And What Lays Ahead

What’s In-Play Now

It has been about 2 months since the gold stock sector, as represented by the HUI index, topped out. The ensuing correction has been a whipsaw affair of ups and downs, but smoothing that volatility out we find an ongoing correction in time and price that has not been too difficult to manage.

The pattern that some would call a “complex H&S” (TA-speak for a freakish pattern with too many shoulders) held a key lower high on the recent bounce to the daily chart’s SMA 50 (blue line). The neckline has been tested (and held) twice since it was created in September and the negative RSI divergence that began last summer has been guiding Huey downward.

hui

It’s all normal and by the chart above you can see the targets, which have been 195 (minor support) and better support at the convergence of a lot of markers, including major breakout support and a gap at 180, the rising SMA 200 (183), a 62% Fib retrace (182) and finally, the pattern’s measurement at around 172. That’s a lot of technical traffic pointing to the 170s-180s for the correction’s ultimate goal, which is to wash out the excess.

And excess there sure was, as we noted well ahead of time in NFTRH using this chart showing how far HUI got ahead of what I consider the most important macro fundamental indicator for the sector, gold vs. stocks and in particular gold vs. the US S&P 500. Continue reading "The Gold Stock Correction And What Lays Ahead"

Weekly Futures Recap With Mike Seery

S&P 500 Futures

The S&P 500 futures in the December contract settled last Friday in Chicago at 2970 while currently trading at 2993 up about 23 points for the week as this market looks to move higher, in my opinion, however, I'm currently not involved.

The S&P is trading above its 20, and 100-day moving average as the trend has turned higher. However, the chart structure is poor at the current time. Therefore, the risk/reward is not in your favor. Still, I am not recommending any short position as I do think going into the holiday season prices will hit all-time highs.

We are in the midst of earnings season as that will undoubtedly dictate short-term price action, and so far, the earnings have been very solid as the U.S economy by far is the best in the world. If you take a look at the daily chart, there is major resistance at the 3000 level, and if we can close above that area, I think prices could be off to the races as extremely low-interest rates are also helping to support stock prices at this time.

TREND: HIGHER
CHART STRUCTURE: POOR
VOLATILITY: AVERAGE

Continue reading "Weekly Futures Recap With Mike Seery"