The background for the copper market is not brighter these days as the macroeconomic data of the top metal consumer - China points at the cooling economy. Asian traders stored up the metal at the start of this year, pushing the price above the $2 mark to a high of $2.3. Nowadays weakening demand puts pressure on copper prices as the Chinese currency hit a 6-year low against the dollar which makes the import more expensive.
Chart 1 Copper Weekly: Support Is At The Gunpoint
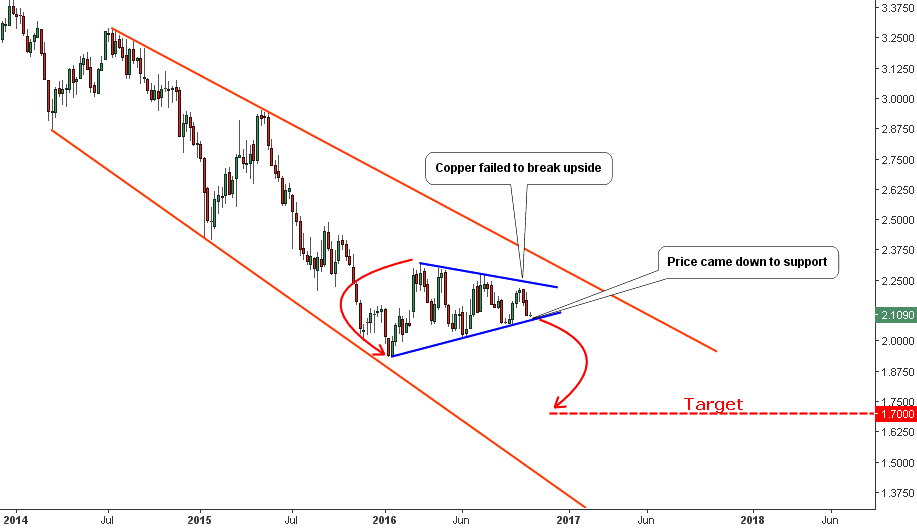
Chart courtesy of tradingview.com
Copper’s price has been descending within an orange expanding downtrend for the past two years. The Contracting Triangle pattern (highlighted in blue) reflects the sideways structure of the market this year. Continue reading "Freeport-McMoRan Could Be In Trouble As Copper Approaches A Decision Point"