Silver has overshot the target set at the $20 mark in my June post leaving the gold in the dust. The AB/CD concept is simple yet effective as it utilizes perpetual Fibonacci ratios.
Ok, that’s done, but what is next? Let’s look at the charts below. I put the monthly chart first to refresh the global outlook for the soaring metal.
Chart 1. Silver Monthly: The Game Just Started!
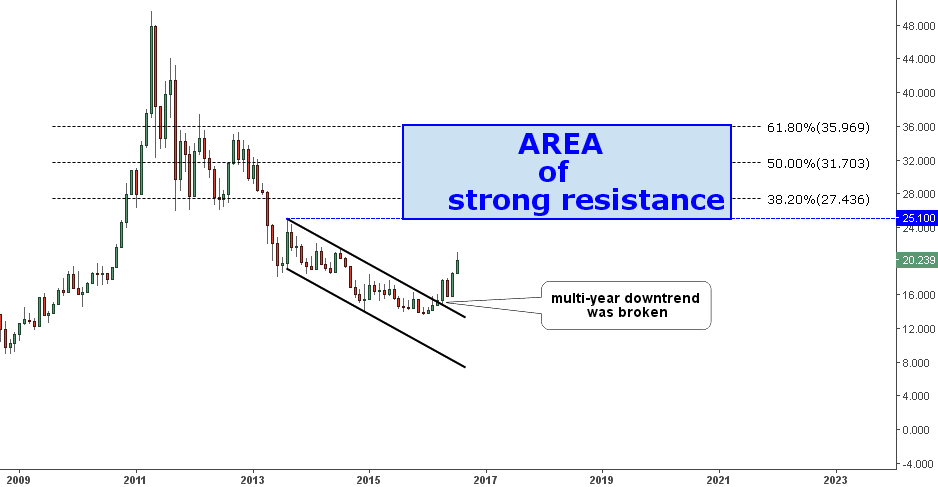
Chart courtesy of tradingview.com
The metal has finally shot above the black downtrend, which I was talking about in my March update. It was a vital need for silver to break loose from the multi-year grip to stop the drop. Continue reading "Silver Has Hit The Target And Marked A New One!"