The price of crude oil closed above the earlier top of $54.6 last Friday to confirm the reversal to the upside. So, is it the right time to find out how far we can go with it?
At the end of last May, I posted an early warning of the imminent crash of crude oil price amid the mass media euphoria from the dream of the $100 price tag per barrel, which was a good contrarian indicator. The price of WTI finally dropped last October after it broke long-term support.
I am very grateful to you as you were very active on the poll where I asked you to share your expectations about the crude oil price by the end of 2018. Below are the results of it.
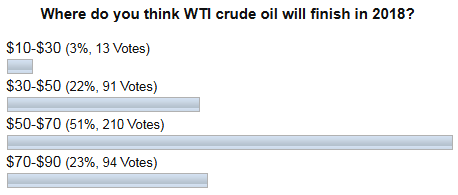
As we can see most of you were ready for the drop of the oil price in the next lower range between $50 and $70 marks, although there were oil optimists in second place, who bet on the price to be in the $70-$90 range. Only those whose bets ranked the third ($30-$50) turned out to be right as oil finished the previous year at $45.8 after hitting the $42 area the day before Christmas.
In this post, I would like to show you some historical similarities, which could help us to understand how deeply the current pullback could go. Let’s start with the bigger chart. Continue reading "How Far Could Crude Oil Go?"