Brutal Week Comes To A Disappointing End

Hello traders everywhere. There is no doubt that this week has been brutal for traders with the stock market posting one of the worst weeks of the year. You only have to look at the DOW, and it's over 1300 point loss on the week for evidence. The DOW and S&P 500 will close down around 6% on the week. Both indexes are in corrections, and both are on track for their worst December performance since the Great Depression in 1931, down more than 11% each this month.

DOW

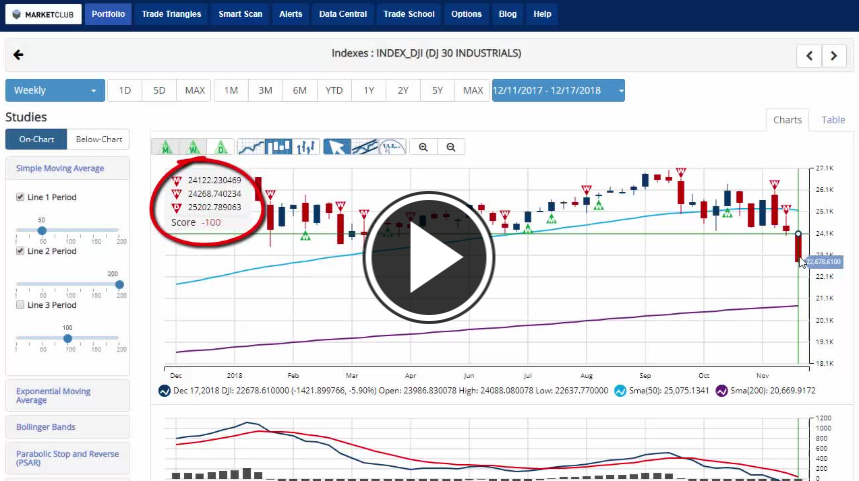
The NASDAQ is having it's worst week in nine months losing over 7% and officially entering a bear market. It's actually trading at a new fifteen-month low. With that move lower we finally got the red weekly Trade Triangle that we've been waiting on. The NASDAQ has now joined the DOW and S&P 500 with negative long-term downtrends. It looks like that death cross may have been right after all.

Key Levels To Watch Next Week:

Continue reading "Brutal Week Comes To A Disappointing End"

REIT ETFs May Be Better Than Equity ETFs

A report issued last year called the “Historical Returns of the Market Portfolio,” looked at the performance of worldwide financial assets for the modern era, from 1960 to 2015. The researchers Laurens Swinkels of Erasmus University, Rotterdam, Trevin Lam of Rabobank, and Ronald Doeswijk, found that during the observed time frame global stocks returned 5.45% a year, non-government bonds returned 3.5% a year, and government bonds returned 3.06% a year. But, shockingly the best assets class from 1960 until 2015 was actually real-estate investment companies and trusts, which produced a yearly return of 6.43%.

The difference of a Real-Estate Investment Trust portfolio and a global equity portfolio for a period of 20 years would mean the REIT portfolio would have beaten the global stock portfolio by nearly 30%. Furthermore, the REITs performed very well when looked at on a per decade basis. The 1990s was the only decade in which REITs didn’t perform, as returns were just above zero. But that decade following the 1980s when things were booming. This all while stocks performed poorly in the 1970s, which just barely producing positive returns, and from 2000 until 2010 when global stock returns were actually negative.

In addition to performing better than stocks on a per-decade basis, real-estate’s worst year was never as bad as stocks worst year but its best year was better than global stocks best year. More so, it had fewer years in which it fell more than 10% than the number of years in which stocks fell 10% or more. Continue reading "REIT ETFs May Be Better Than Equity ETFs"

World Oil Supply, Demand And Price Outlook, December 2018

The Energy Information Administration released its Short-Term Energy Outlook for December, and it shows that OECD oil inventories likely bottomed in March at 2.807 billion barrels. It estimated a 10-million barrel gain for November to 2.902 billion. Though it forecasts that stocks will drop in December to 2.894 billion, that is 50 million barrels higher than a year ago.

Throughout 2019, OECD inventories are generally expected to rise, reaching 3.010 billion barrels in November. Its projections end the year with 88 million barrels more than at the end of 2018, glut territory.

oil

OPEC pledged to cut its production by 800,000 b/d from the October level for the first six months of 2019. EIA estimates OPEC production at 32.9 million barrels per day (mmbd), including Qatar, which will no longer be a member of OPEC in January. EIA’s assume OPEC production for 2019 is 31.8 mmbd, and so that represents a larger 1.1 mmbd drop. Continue reading "World Oil Supply, Demand And Price Outlook, December 2018"

Weekly Futures Recap With Mike Seery

We've asked Michael Seery of SEERYFUTURES.COM to give our INO readers a weekly recap of the Futures market. He has been Senior Analyst for close to 15 years and has extensive knowledge of all of the commodity and option markets.

Michael frequently appears on multiple business networks including Bloomberg news, Fox Business, CNBC Worldwide, CNN Business, and Bloomberg TV. He is also a guest on First Business, which is a national and internationally syndicated business show.

Gold Futures

Gold futures in the February contract settled last Friday in New York at 1,252 an ounce while currently trading at 1,240 down about $12 for the trading week lower for the 2nd consecutive session. I have been recommending a bullish position from around the 1,252 level, and if you took that trade, the stop loss has been raised to 1,226 as the chart structure is outstanding due to the low volatility. Gold prices hit a five-month high in last week's trade, but the U.S. Dollar has hit a 1.5 year high today as that is putting pressure on gold and the precious metals across the board as I will not 2nd guess as I will continue to place the proper stop loss and see what next week's trade brings. Money flows have been exiting the U.S equity market rather dramatically over the last several weeks as that has helped push gold prices higher as I also have a bullish silver recommendation which is also under pressure in today's trade. The next major level of resistance around the 1,255 level and if that is broken I think there is the possibility prices could trade up to the 1,300 level in the coming weeks or months ahead as I would have to believe that the volatility will start to expand as we exit 2018.
TREND: HIGHER
CHART STRUCTURE: EXCELLENT
VOLATILITY: LOW

Continue reading "Weekly Futures Recap With Mike Seery"

How Low Could The S&P 500 Go?

Our target for the first half of 2019 is and has been the 2100 to 2200 area for the S&P 500. A friend asked…

I’ve been meaning to ask (and possibly) know the answer, 2100-2200 for H1 2019 is your ultimate bear market target or opening act?

Opening act. It could be the ultimate target because there is a lot of support at that area and a good solid bear phase could put the Fed on ice and impose some changes to Donald Trump’s bull in a China shop policy style.

So, for now, I see no reason to make dire proclamations beyond that key support level, as so much will depend on incoming information in 2019. At this point, even 2100-2200 is not technically in the bag because the US stock market clung to last-ditch daily chart support, as per the marginally favored short-term NFTRH view. So all of we bear callers need to remember that as ugly as the charts are, support is not broken until it is… broken.

I was going to cover this in NFTRH 530‘s Opening Notes segment, but why not make it a public post and save NFTRH’s virtual ink for more immediate issues going on with the markets? Before we dial out to a couple of simple SPX charts showing the prospective downside targets, let's review the situation with a less than simple chart. Continue reading "How Low Could The S&P 500 Go?"