Here we are on the final track of the year, and investors hope for the traditional Santa Claus rally in the precious metals sector. This euphoria of the anticipated strength based on the current move up could be spoiled if this pattern would emerge in the US dollar index (DXY).
Chart 1. US Dollar Index Daily: Triangle
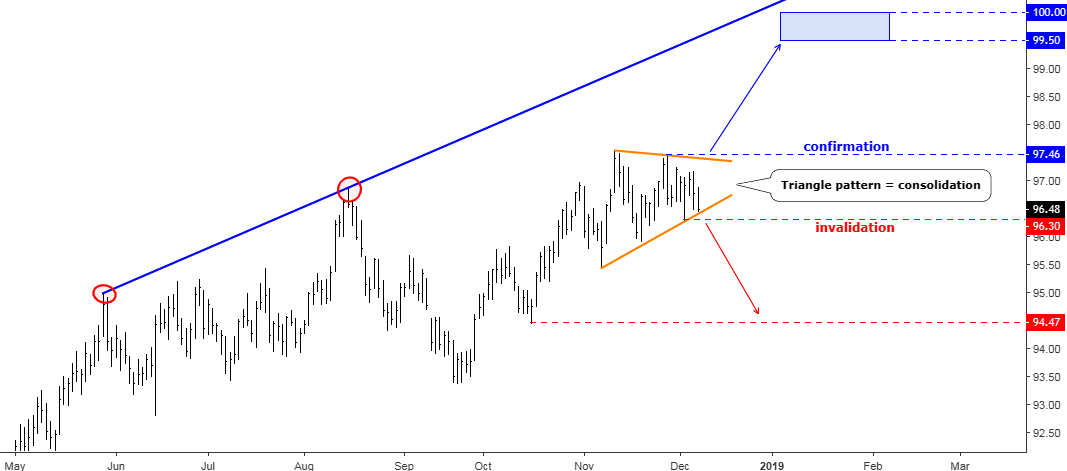
Chart courtesy of tradingview.com
The disappointing data of US non-farm payrolls released last Friday couldn’t damage the US dollar as it kept above the former trough established on the 4th of December at 96.30. The first reaction in the market was a USD sell-off against all major currencies, but it was short-lived, and none of the former extremes were breached. This made me focus on the Dollar Index chart to see if there is some pattern or trading setup has been shaping amid this unusual market behavior. Continue reading "Gold & Silver: US Dollar Could Spoil Santa Claus Rally"