Will Gold Outshine Silver?

The collective mind of the Blog's readers has proved to be very powerful as the majority of you guessed it right last time, that the U.S. dollar index (DXY) will reverse down. My assumption that precious metals will start to grow also played out accurately so far, and one could get the clue of DXY reversal from the assumption mentioned above.

In this update, I added minor annotations for fine-tuning previous charts as I switched to a lower time frame of 4-hour. The final chart below will show you the background for the title of this post. Let us start with the DXY 4-hour chart.

Dollar Index

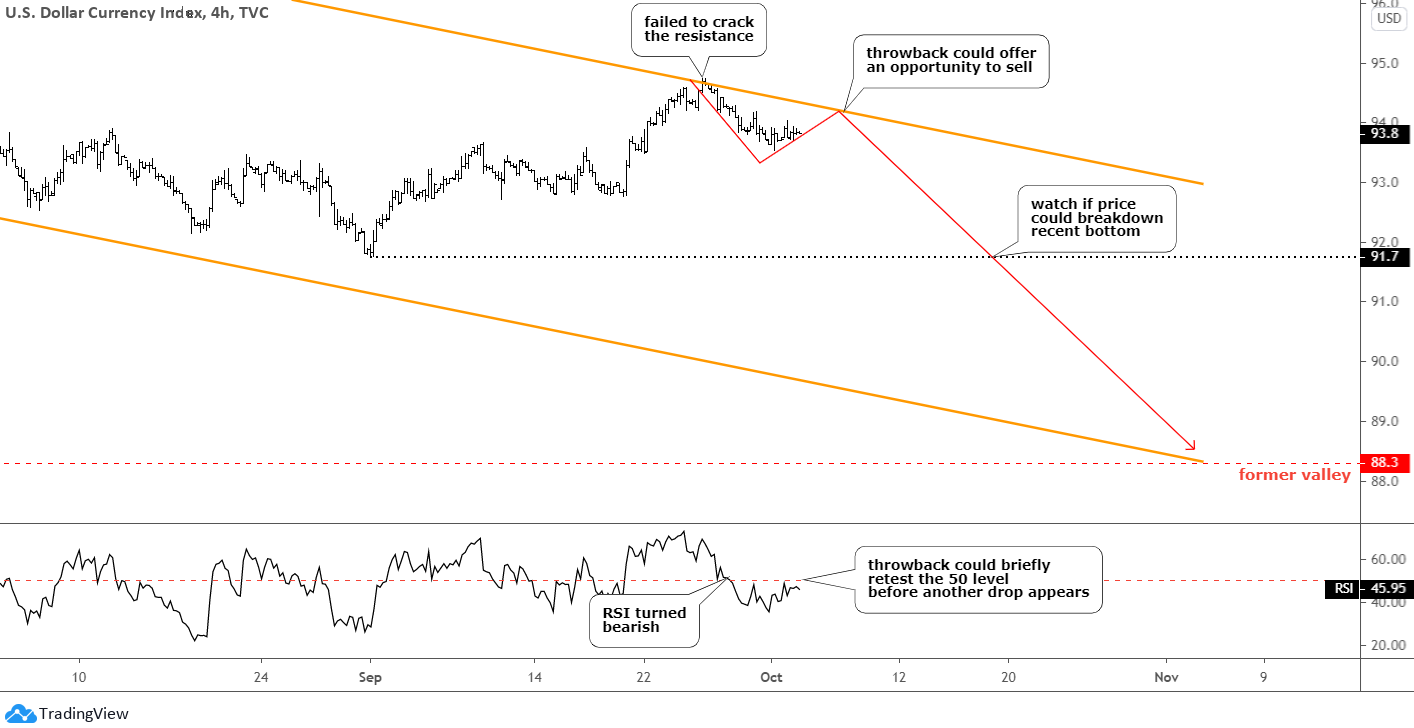
The market indeed saw that orange trendline resistance as the price reversed right at that point. The RSI turned bearish now as it broke below the crucial level of 50. The indicator raises its head together with the price, which could throwback to retest the resistance. The former could briefly overthrow the crucial level, and then it should drop below it again to confirm the Dollar's further weakness. Continue reading "Will Gold Outshine Silver?"

Extreme Volatility Hits Natural Gas Futures

Natural Gas Futures

Natural gas futures in the November contract settled last Friday in New York at 2.80 while currently trading at 2.43, down about 37 points for the week, hitting a 2 month low.

I am not involved as the volatility is extremely high. That situation isn't going to change as we enter the winter months as seasonably speaking, you can have tremendous price swings daily. I will be looking at a counter-trend trade soon. I think the contract low, which was hit on June 25th at 2.13, will keep a close eye on this market as I think a bottoming situation is starting to occur.

Gas prices are trading under their 20 and 100-day moving average as the trend is mixed to lower in my opinion as prices topped out right around the 3.00 level just several weeks ago. Fundamentally speaking, industrial natural gas demand remains tepid as BNEF data shows gas demand from power generators was estimated at just under 30 bcf for last Monday, which is the lowest for any September 21st since 2015.

TREND: LOWER - MIXED
CHART STRUCTURE: POOR
VOLATILITY: HIGH

Orange Juice Futures

Orange juice futures in the November contract is currently trading at 111.85, ending the week on a sour note after settling last Friday in New York at 105.75, up over 600 points for the week bottoming out around the 105 level. Continue reading "Extreme Volatility Hits Natural Gas Futures"

Chop & Grind: Gold, Stocks And Commodities

Whether the market is foreign or domestic, equity, commodity, or metal the grind is on. Speaking of grind, the one in gold has been expected as the metal builds out its big picture Handle to the bullish Cup with an objective that is much higher. Let’s take a look at a few NFTRH charts to gauge the grind in several markets and by extension, the grind many feel on their nerves these days. It’s not a time to make money. It’s a time to preserve gains and patiently position.

For gold, the grind would be the making of a Handle after the Cup’s key higher high to the 2011 high.

gold price

The daily chart below shows the form it is taking; a falling wedge toward the first support area just above 1800. If the monthly chart above is to make a substantial Handle the gold price correction could extend to a test of the rising 200-day average. RSI and MACD are negative.

Easy now, it’s not a prediction, but don’t let the perma-pompoms tell you it is not doable. Let’s keep it muted ladies. Continue reading "Chop & Grind: Gold, Stocks And Commodities"

Monthly Dark Cloud Cover Pattern May Be Calling The Top

Research Highlights:

  • A Dark Cloud Cover pattern is a Japanese Candlestick Pattern that is typically associated with major top setups
  • Critical Support on the SPY highlighted by multiple technical analysis strategies suggests 335~335.25 is acting as a major support level
  • If price stays below the $339.95 level, then we interpret the trend as being Bearish. If price moves above the $343.55 level, it is Bullish

Critical Support on the SPDR S&P500 ETF (SPY) highlighted by multiple technical analysis strategies suggests 335~335.25 is acting as a major support level. The rally in the markets that started late Sunday and carried forward into early trading on Monday, September 28, 2020, suggests the market is attempting to rally above this support level to establish a potential momentum base. My advanced price modeling systems and Fibonacci Price Amplitude Arcs (originating from the 2009 bottom) have clearly identified this area as a critical resistance/support zone.

The first chart below highlights the SPY Monthly chart data and shows the recent peak in price that broke through the major resistance level near 335, then collapsed back below that same level. Prior to this recent collapse, the COVID-19 peak in February also briefly touched this same resistance level – confirming it as valid. We believe the current price activity suggests the markets are attempting to form some sort of price base above this $335 level on the SPY.

Dark Cloud Cover Pattern

As you can see from the recent highs on the chart above, there is a new Fibonacci Price Amplitude Arc range set up by the COVID-19 collapse that may interrupt this Base Setup process. Look for the smaller OBLIQUE on the chart near where the word “Support” is. This is a new Fibonacci Price Amplitude Arc that reflects the most recent price range activity into targeted Fibonacci based price zones. Continue reading "Monthly Dark Cloud Cover Pattern May Be Calling The Top"

U.S. Petroleum Inventories Fall

According to the Energy Information Administration, U.S. petroleum inventories (excluding SPR) fell by 7.5 million barrels last week to 1.422 billion, and SPR stocks dropped by 0.8 million barrels. Total stocks stand 128 mmb above the rising, rolling 5-year average and about 128 mmb higher than a year ago. Comparing total inventories to the pre-glut average (end-2014), stocks are 363 mmb above that average.

US Total Oil Stocks

Crude Production

Production averaged 10.7 mmbd last week, off 200,000 mb/d from the prior week. It averaged 10.325 mmbd over the past 4 weeks, off 16.9 % v. a year ago. In the year-to-date, crude production averaged 11.766 mmbd, off 3.2 % v. last year, about 400,000 b/d lower. Continue reading "U.S. Petroleum Inventories Fall"