Platinum Could Rocket To $1912

Last time I updated the platinum chart in March was when "Palladium Pushed Platinum To A Record Low" within the ratio mostly due to the strength of palladium. Platinum has hovered around $900 for three years now as it was lost and forgotten after the “execration” of diesel engines. This "fallen angel" had been shaping a sideways consolidation this past spring, and I had thought it could repeat 2018’s drop following the same structure. The targets were set at the $640 and $401 on the downside, and the invalidation point was assigned to $1034.

Let's see below how you voted for the future of platinum.

Platinum

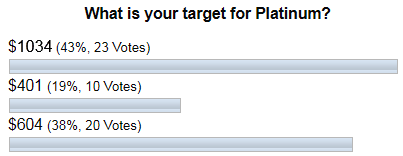
Most of you picked the $1034 option, which implied the breakout of the consolidation in the upside direction towards the invalidation area. This was the closest call as the majority voted for a bullish move, which, indeed, had happened as platinum couldn't break below the consolidation valley of $788 and bounced up to reach the $1000 level this past September. That price hasn't been seen since February 2018. Again, this was your amazingly accurate prediction, not only for that period but also for a longer-term outlook as I spotted it in the big chart below. Continue reading "Platinum Could Rocket To $1912"

VIX Warns Of Imminent Market Correction

The VIX is warning that a market peak may be setting up in the global markets and that investors should be cautious of the extremely low price in the VIX. These extremely low prices in the VIX are typically followed by some type of increased volatility in the markets.

The US Federal Reserve continues to push an easy money policy and has recently begun acquiring more dept allowing a deeper move towards a Quantitative Easing stance. This move, along with investor confidence in the US markets, has prompted early warning signs that the market has reached near extreme levels/peaks.

VIX Value Drops Before Monthly Experation

When the VIX falls to levels below 12~13, this typically very low level is usually associated with an extreme peak in price. Throughout history, after the VIX has collapsed to these types of low price levels, the markets have a tendency to revert/correct in ranges that are typically in excess of 3.5% to 5.5%. In some cases, these corrections have been as large as 11% to 18% or more.

VIX
Continue reading "VIX Warns Of Imminent Market Correction"

Weekly Futures Recap With Mike Seery

Gold Futures

Gold futures in the December contract settled last Friday in New York at 1,462 while currently trading at 1,466 up about $4 for the week. However, ending the week on a sour note as all of the interest still lies in the S&P 500, which is hitting another all-time high as money flows continue to come out of gold.

At the current time, I do not have any precious metal recommendations, but I do believe gold prices are headed lower as I see no reason to be a buyer as prices are right near a 3 1/2 month low. Gold prices are trading under their 20 and 100 day moving average as the trend is to the downside, and if you take a look at the daily chart, the down trend line also remains intact as optimism about a trade deal with China continues to depress prices in the short-term.

The 10-year note is currently yielding 1.90% as that has rallied from 1.30% just a couple of months ago and that is also another negative after towards gold prices so if you are short stay short in my opinion so place the stop-loss above the 10-day high which stands at 1,517 as an exit strategy.

TREND: LOWER
CHART STRUCTURE: IMPROVING
VOLATILITY: AVERAGE

S&P 500 Futures

The S&P 500 in the December contract settled last Friday in Chicago at 3090 while currently trading at 3112 up about 22 points for the trading week, hitting another all-time high as the gravy train continues and I still believe it will continue throughout the holiday season. Continue reading "Weekly Futures Recap With Mike Seery"

World Oil Supply And Price Outlook, November 2019

The Energy Information Administration released its Short-Term Energy Outlook for November, and it shows that OECD oil inventories likely bottomed last June 2018 at 2.794 billion barrels. It estimated stocks rose by 1 million barrels in October to 2.909 billion, 69 million barrels higher than a year ago.

For the balance of 2019, OECD inventories are projected to stabilize at 2.900 billion, 55 million higher than end-2018. For 2020, EIA projects that stocks will build by 59 million barrels to end the year at 2.959 billion.

Oil

The EIA estimated that OPEC production rose by 1.325 million barrels per day in October, 1.3 of which was in Saudi Arabia due to the recovery from the attack on its oil facilities. It is estimating that OPEC production averaged about 29.52 million in October. For 2020, it estimates that OPEC production will average about 29.52 million, about 160,000 b/d above the call (demand) for OPEC oil in 2020. Continue reading "World Oil Supply And Price Outlook, November 2019"

Zero Fee Trades Likely Means Lower Fee ETFs - Part 2

Now that its clear investors understand how fees affect their returns and the financial industry as a whole is responding by lowering trading commissions to zero and cutting management fees on funds, its just a matter of time until we see ‘indexed’ funds begin to offer zero or near zero, as in 0.01% expense ratio, fee funds.

Why? Simple because they have to stay competitive if they want to stay in business.

For years the biggest argument for one someone would buy an index fund is because it would be so cumbersome and costly to go out and buy a few shares of all the different stocks that make up a specific index. For example, if an investor wanted to mimic the Dow Jones Industrial Average, they would need to go out and buy one share of each of the 30 companies that currently make up the index.

In the past, that would be 30 different stocks in someone’s personal portfolio, which honestly isn’t that much higher than what the average retail investor owns, typically somewhere between 15 and 20. However, that would also mean the investor would have paid a trading commission 30 different times in order to set up that portfolio (1 trading commission for each different company they bought a share or multiple shares of). If the average investor was paying $4.95 per trade, that’s $148.50 in trading commissions just so they could mimic the Dow Jones Industrial Average without having to pay a mutual fund or ETFs fees every year. Continue reading "Zero Fee Trades Likely Means Lower Fee ETFs - Part 2"