Gold & Silver: The Volcano Awoke

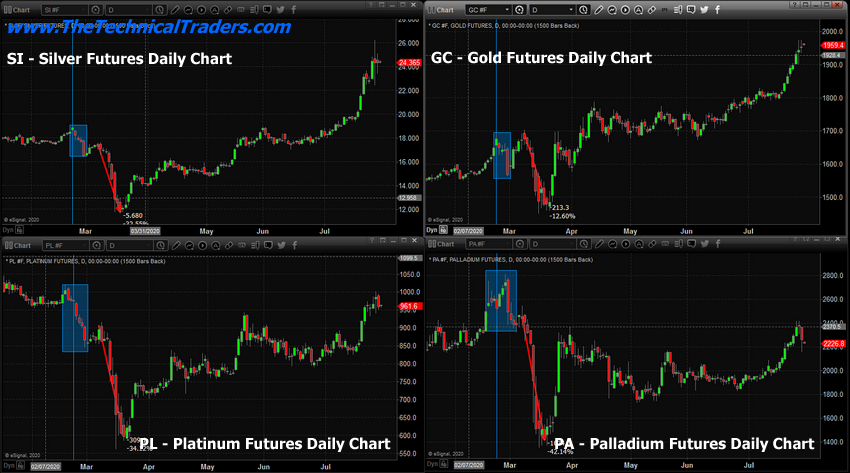
Before we get down to the charts, let's look around to see what pushed the precious metals higher as gold posted a new all-time high last Friday at $1985, just shy of the next thousand. The silver price more than doubled since its severe crash in March. Indeed, the precious metals "volcano" awoke erupting its power on fiat, which has been printed heavily. I warned about this trigger in my April post called "Gold Could Fly Over A Helicopter Throwing Money". More than three months have passed since then, why "volcano" erupted only now?

Among the reasons, an escalating trade war and the COVID-19 pandemics. It's all about the relationship between the two largest economies and the health of each of them. US gross domestic product fell at an annualized rate of 33% in the second quarter, said the Commerce Department last Thursday. It's the largest fall on record dating back to the 1940s. The hope for a quick rebound is escaping as economists don't see the recovery to the prior peak until 2022. This contrasts with a V-shaped rebound of the Chinese economy, which showed 3.2% growth in the second quarter after a -6.8% crash in the first one. But that is not enough to restart the global economy as each player matters.

I guess the main driver for the sharp rally of the top metals was the smell of a possible cold war or even a real military collision between the US and China, that appeared recently. I hope it won't happen, but investors are hesitant to bet when this turmoil will end, so they rush to the safe-haven metals to wait through this uncertainty. At the same time, the US dollar index has been sold off dropping from its multi-decade peak at 104 that was hit in March down to the current 93 level. The nearest support is located at 88, the valley that was established in February of 2018. This leaves the room for the top metals to grow even more.

Let's get down to the updated charts, and the daily gold chart will be the first. Continue reading "Gold & Silver: The Volcano Awoke"

Futures Market Showing Signs Of Life

Natural Gas Futures

Natural gas futures in the September contract settled last Friday in New York at 1.86 while currently trading at 1.85 unchanged for the trading week and looking for a trend to develop to the upside, in my opinion. Currently, I am not involved as I am waiting for a bullish trend to develop. I think there's a high probability that a spike bottom was created on June 26th at 1.58. In general, the commodity markets are starting to show signs of life as the U.S. dollar continues its bearish trend.

Gas prices are now trading above its 20-day but still below its 100-day moving average. However, if you take a look at the daily chart, major support has developed between 1.60/1.65, so look to play this to the upside in the coming weeks ahead as I believe the risk/reward would be in your favor. The chart structure will also start to improve daily; therefore, the monetary risk will be reduced in next week's trade. Historically speaking, prices are incredibly depressed.

TREND: MIXED
CHART STRUCTURE: IMPROVING
VOLATILITY: AVERAGE

Silver Futures

Silver futures in the September contract settled last Friday in New York at 22.85 an ounce while currently trading at 23.94 up over $1.00 for the trading week as prices are right near a 7-year high. Continue reading "Futures Market Showing Signs Of Life"

Post COVID-19 -100% Options Win Rate

A total of 76 options trades were placed in May, June, and July as the market rebounded after the COVID-19 market lows. During this timeframe, all 76 trades were winning trades to lock-in a 100% option win rate with an average income per trade of $190 and an average return on investment (ROI) per trade of 7.6%. After the tumultuous market lows of March and into early April, leveraging a minimal amount of capital, mitigating risk and maximizing returns was paramount. The objective of an options-based portfolio can offer the optimal balance between risk and reward while providing a margin of downside protection with high probability win rates.

As the market continues to rebound, optimal risk management is essential when engaging in options trading as a means to drive portfolio performance. When engaging in options trading, risk mitigation needs to be built into each trade via risk-defining trades, staggering options expiration dates, trading across a wide array of uncorrelated tickers, maximizing the number of trades, appropriate position allocation and selling options to collect the premium income.

Getting creative and customizing your option trade structure is another element that can be layered into the overall strategy for long-term success in options trading. Maintaining disciple via continuing to risk-define trades, leveraging small amounts of capital while maximizing return on investment, is essential despite the impressive streak of 76 consecutive winning trades.

3 Months Post COVID-19 Results

After placing 76 trades throughout May, June, and July, a 100% win rate, 99% premium capture, and 7.6% ROI per trade was achieved. This was accomplished via leveraging a minimal amount of capital and maximizing return on investment with risk-defined trades. Deploying a combination of put spreads and custom put spreads was used to optimize the risk-reward profile for these 76 trades. Whether you have a small account or a large account, a defined risk (i.e., custom put spreads) strategy enables you to leverage a minimal amount of capital, which opens the door to trading virtually any stock on the market regardless of the share price. Risk-defined options can easily yield double-digit realized gains over the course of a typical one month contract (Figures 1, 2, and 3).

Options
Figure 1 – Average income per trade of $190, the average return per trade of 7.6% and 99% premium capture over 76 trades in May and June
Continue reading "Post COVID-19 -100% Options Win Rate"

Big Tech Post Earnings Blowout

Facebook, Apple, and Amazon are leading the tech sector after announcing better than expected earnings. However, as we head into the close, all three major indexes have dipped into the red for the day.

As far as the weekly numbers go, the S&P 500 will likely eke out a weekly gain of roughly +.5%. The DOW, on the other hand, will suffer it's second straight weekly loss standing at -1.3% while the NASDAQ, on the back of the big earnings blowout by the big three, will post a weekly gain of +2.4%.

Facebook (FB) reported earnings of $1.80 vs. $1.39 per share with a revenue of $18.7 billion vs. $17.4 billion. Continue reading "Big Tech Post Earnings Blowout"

Precious Metals Warn Of Increased Volatility

Are the precious metals patterns predicting a big downside price event?

Our trading team witnessed a big drop in Platinum and Palladium prices early this morning while Gold and Silver continued to push moderately higher. We began to question this move and investigate any historical relevance to previous patterns. Our research team pointed out that both Platinum and Palladium rolled lower just 3 to 4 days before the breakdown in the US stock markets on February 24, 2020, while Gold and Silver were reaching recent price peaks. Could the patterns in precious metals be a warning of another potential volatility spike and price decline in the near future?

Our research team created the charts below to help highlight the pattern that we are seeing in Precious Metals right now. First, we highlighted February 24, 2020, with a light blue vertical line to more clearly illustrate where the markets initiated the COVID-19 breakdown event. Next, we drew shaded rectangles around new downside price rotation levels that took place near this peak in the US stock markets. Lastly, we drew a red line that highlights the subsequent price decline that took place in Precious Metals as the markets tanked in late February and early March 2020.

Precious Metals

The current downside price move in Platinum and Palladium are very interesting because it appears Platinum and Palladium both initiated a downside/contraction price event just 3 to 4 days before Gold and Silver, as well as the rest of the US stock market, began to collapse on February 25, 2020. You can clearly see in the bottom two charts that Platinum and Palladium initiated a downside price correction a few days before both Gold and Silver reached their peak levels and began to move lower. Once this peak rotation took place, all four of the major metals groups moved moderately lower for about 7 days before pausing, then collapsed even further. Continue reading "Precious Metals Warn Of Increased Volatility"