LATAM: Watch Brazil But Buy The Peso

Lior Alkalay - INO.com Contributor - Forex


LATAM currencies are back in the game. Optimism over Brazil’s political future is growing and commodities, a key driver of regional growth, are recovering. Together, much of the uncertainty looming over the region has been removed and put regional currencies -the Brazilian Real, Mexican Peso and Chilean Peso into favor.

One important gauge of rising optimism is the price of Credit Default Swaps. Credit Default Swaps, or CDS for short, measure the cost of insuring against a bankruptcy. When the price of Credit Default Swaps falls, it points on lower risk and higher optimism. As the chart below indicates, Credit Default Swaps have fallen dramatically across the region since February, signaling a surge in optimism in the LATAM space.

LATAM CDS Chart
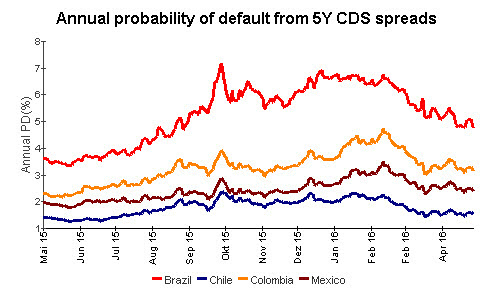
Chart courtesy of Deutsche Bank

But the CDS chart illustrates another very interesting picture. While the fall in risk is across the board, Brazil, the largest economy in the region, is deemed as the most probable to default on its debt by a wide margin compared to much smaller regional peers. Continue reading "LATAM: Watch Brazil But Buy The Peso"

Weekly Futures Recap With Mike Seery

We've asked Michael Seery of SEERYFUTURES.COM to give our INO readers a weekly recap of the Futures market. He has been Senior Analyst for close to 15 years and has extensive knowledge of all of the commodity and option markets.

Michael frequently appears on multiple business networks including Bloomberg news, Fox Business, CNBC Worldwide, CNN Business, and Bloomberg TV. He is also a guest on First Business, which is a national and internationally syndicated business show.

Crude Oil Futures

Crude oil futures in the June contract settled last Friday in New York at 43.73 a barrel while currently trading at 45.73 up about $2 for the trading week hitting a five-month high which has been a very impressive rally over the last 3 months. Crude oil prices are trading above their 20 and 100-day moving average telling you that the short-term trend is higher. However, I have been sitting on the sidelines as the chart structure has not been terrific over the last several months as I do think there is a top in the near future as I think prices can retest $50, but if that happens production will start to come back online. The U.S dollar continues to move lower as that has definitely helped crude oil prices rally about $17 over the last 3 months as the next major level of resistance is around $48. Continue reading "Weekly Futures Recap With Mike Seery"

How The Mighty Have Fallen

Hello MarketClub members everywhere! You have heard me say this many times before, perception is an extremely powerful force in the markets. We see just how powerful this force is with the recent move down of Apple Inc. (NASDAQ:AAPL). Once the darling of the tech world, Apple's time may be over as Alphabet Inc. (NASDAQ:GOOG), Facebook Inc. (NASDAQ:FB) and the mighty Amazon.com Inc. (NASDAQ:AMZN) take over the leadership mantle.

MarketClub's Mid-day Market Report

It's Friday, the end of the week and the end of the trading month. Let's start by looking at how the major markets closed last month and last week. Continue reading "How The Mighty Have Fallen"

The Japanese Gold Trapped In A Large Consolidation

Aibek Burabayev - INO.com Contributor - Metals


This topic was promised in one of my previous posts to our readers, and I am pleased to offer it to you today. I was waiting to see the end of the month price action to try to write when I considered all the moves within a month for more accuracy. Carol and Diane, I should admit you are very brave ladies as when I opened GYEN (The AdvisorShares Gartman Gold/Yen ETF (NYSE Arca: GYEN)) chart I was shocked by all the crazy and abrupt moves there. The history of this ETF is quite short (from 2014), and the analysis based on it would not be solid. At the end of the post, I've added the GYEN chart for you to judge for yourself. I picked the gold/JPY chart instead for analysis as the ETF tracks the price of this pair. I hope you will enjoy the post.

Chart 1. Gold/JPY Monthly: Multi-Decade Uptrend Is Intact

Monthly Chart of GLD/JPY
Chart courtesy of tradingview.com

The multi-decade uptrend highlighted in the chart reflects the trends of both the gold/$ and $/JPY markets. Those markets were extremely bullish for the past decade, and the gold/JPY strong upside move shows the synergy of them. The Big Bull Run here stalled in 2013 while gold/$ stalled two years earlier in 2011. The reason is that the $/JPY bullish move stopped last year and helped to extend the upside move in gold/JPY and then to soften the downside pressure from the falling gold/$. Continue reading "The Japanese Gold Trapped In A Large Consolidation"

Stock of the Week up more than 8.4% in 2 days

INO.com's Stock of the Week

It's been only 2 days since we released this week's stock and, as of 1pm (EDT) today, it's already showing an 8.4% gain.

Send me this week's stock.

This week's pick is a semiconductor company that has put up better than expected quarterly numbers and, as it chips away at a major competitor's market share, it is expected to continue its upward trend in the weeks and months ahead!

If you are already receiving INO.com's Stock of the Week, then we hope you're enjoying your weekly analysis and hopefully you are already profiting from the most recent pick.

Not receiving the Stock of the Week? Want to know what this stock is? We'll send you this week's analysis right away and you'll be one of the first to receive our next pick, issued at 7am EDT on Tuesday.

Send me this week's stock and get a new pick, with an amazing analysis, every Tuesday.

Enjoy,
INO.com & Focused Stock Trader


su*****@in*.com