This past January I wrote about European gold discussing two possible scenarios as the market was at the crossroads. The upside scenario played out. It is good to act once we know the direction as it gives us more confidence. Today I will review gold vs. euro and add silver to the pack. But the very first chart I will dedicate to the peaking euro as the price of the metals is quoted in a single currency.
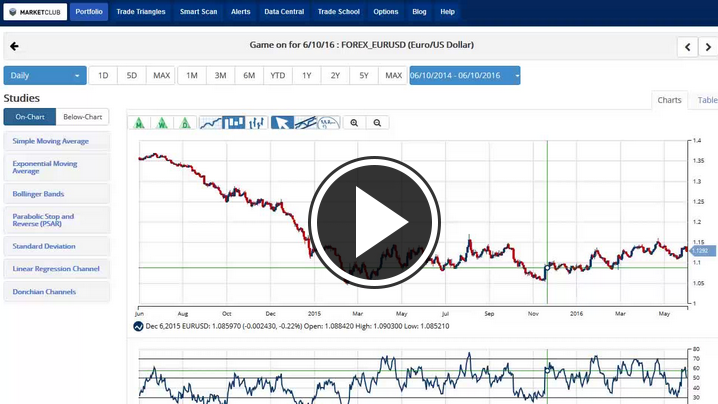
Chart 1. Euro/$ Weekly: Price Is At The Top
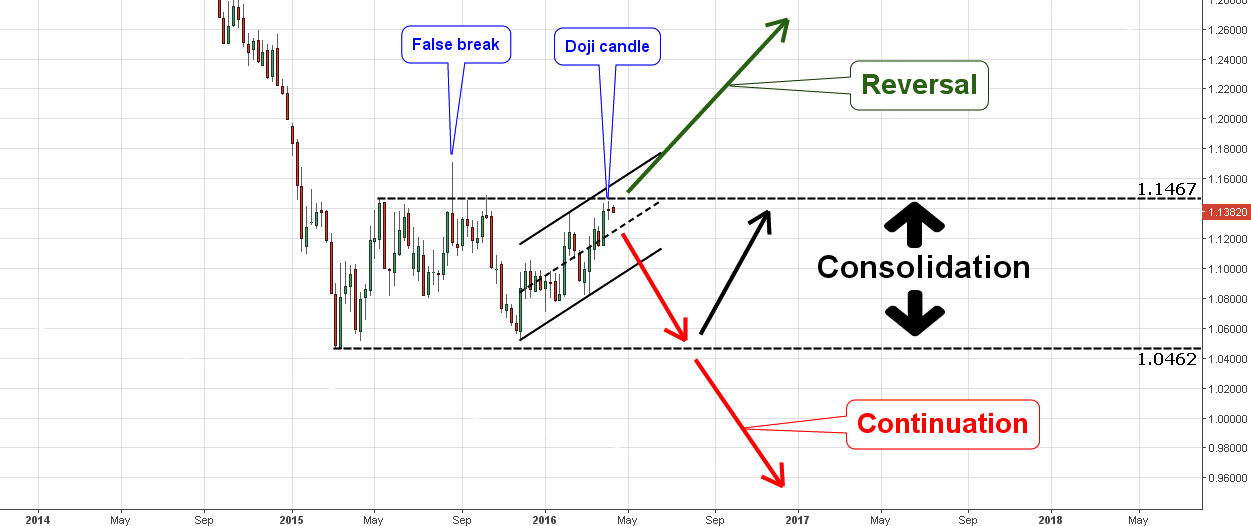
Chart courtesy of tradingview.com
The EURUSD is the most liquid currency pair in the world and it shows the strength of the US dollar, which is the measure of everything in the financial world. The global trend for the pair is down. The Euro hit a multi-decade bottom in 2015 and since then we have been stuck in a wide consolidation with a price range of 10 big figures within $1.0462-1.1467. I didn't take the 2015 high at $1.1714 as you can see that it was just a false break above the horizontal resistance. The price quickly fell back below resistance and closed a dip below it.
Last week shaped a reversal Doji candle, which, of course, needs further confirmation on the chart. We should see a quick drop below the middle of the channel (black dashed line) at the $1.1240 level.
The euro should break below $1.0462 to confirm the continuation of the global trend; it will certainly add to the bullishness of precious metals against this currency. If we get a weekly/monthly close above $1.1467, then we should watch closely after the reversal which will undermine the metals market in Europe. The third path is a prolonged consolidation as a result of the price reversal from the lower margin at $1.0462.
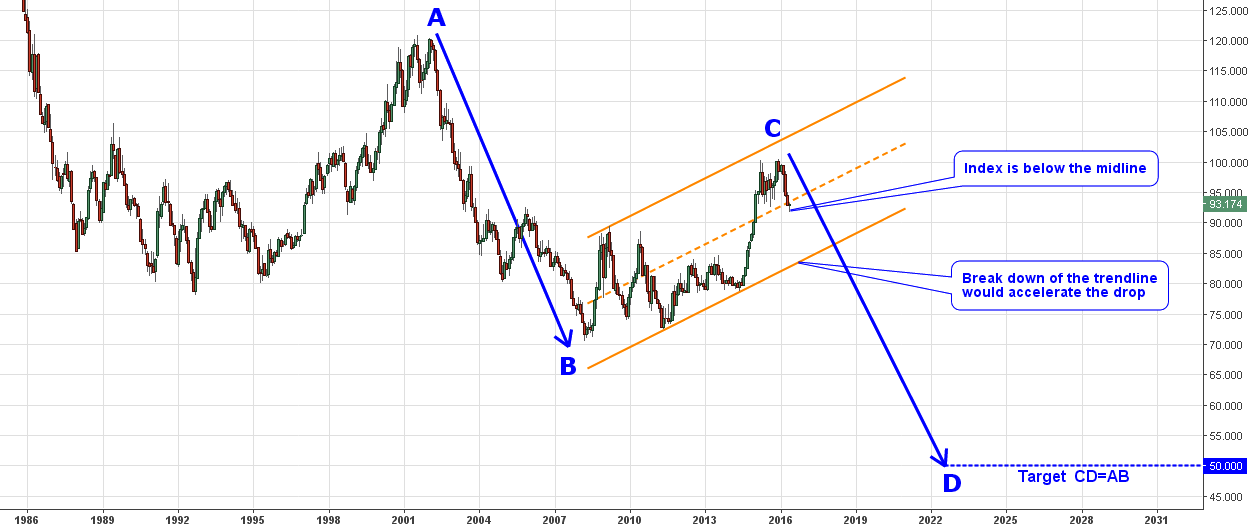
Chart 2. Gold vs. Euro Monthly: Break Up & Correction, Ready For Action!
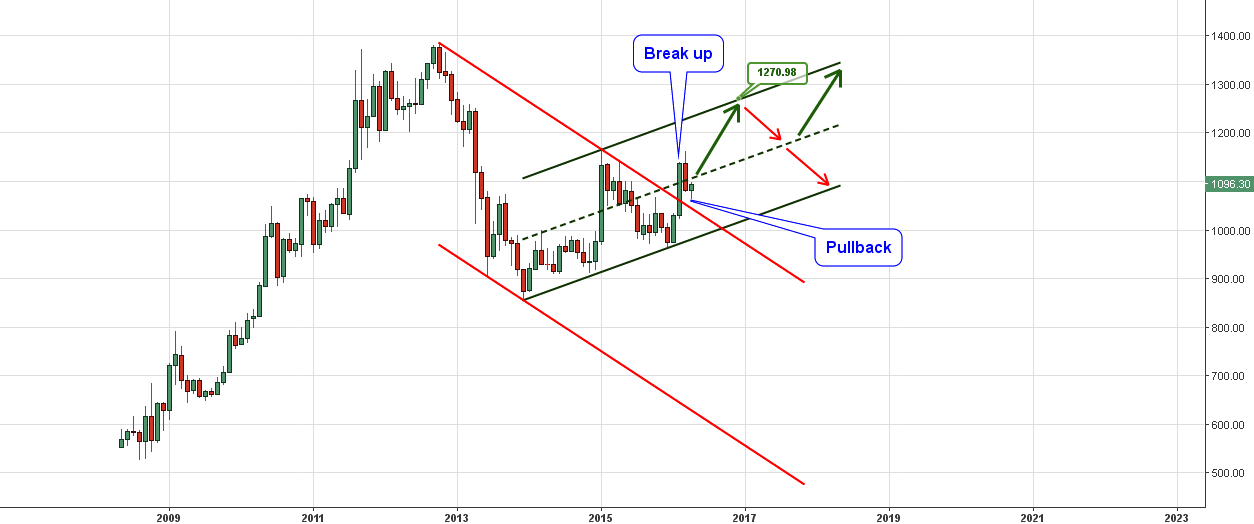
Chart courtesy of tradingview.com
Gold was nimble enough to penetrate the upside of the downtrend at EUR 1065 in February. It is a good trigger for buyers. Patient traders prefer to wait for a good pullback to enter with safe stop (just below the trend) for a low-risk trade. And we can see this classic price action on the chart. It looks like the pullback has finished at the low of EUR 1065 (same price for the breakup) as the price rapidly advanced higher. Once the price passes the high at EUR 1165, we can move the stop to breakeven and enjoy the lossless bet.
The target is located on the upside of the trend at EUR 1270, if you read the earlier gold-euro post, you can see that the AB/CD concept also points to that level (EUR 1272). It's not a coincidence as both the trend model and the AB/CD concept use simple mathematical calculations.
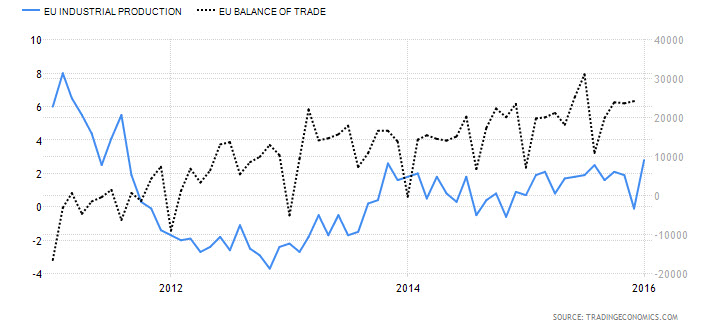
Chart 3. Silver vs. Euro Monthly: Wait for Breakout!
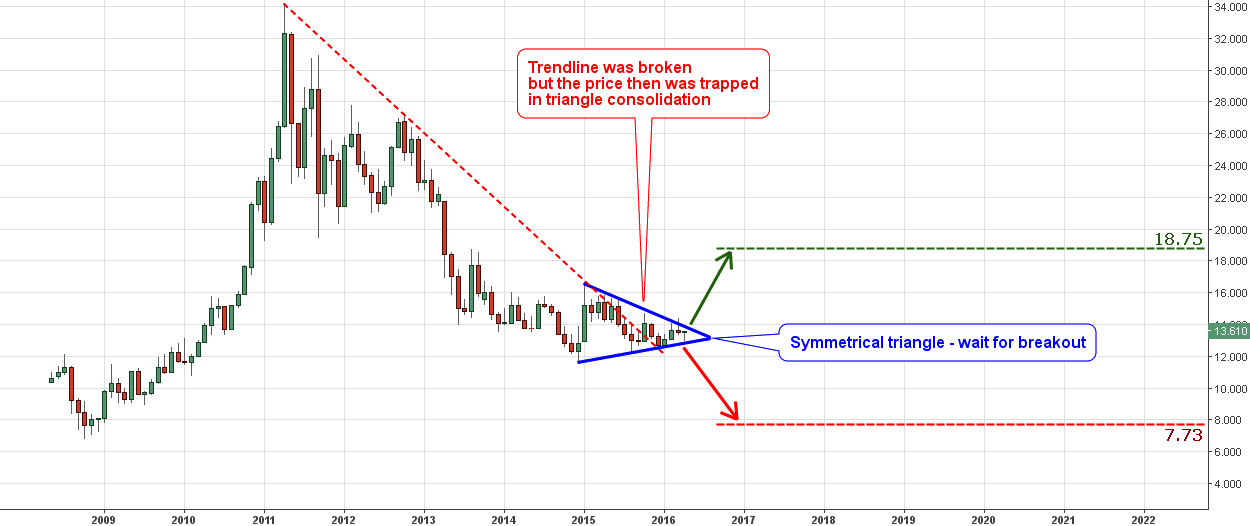
Chart courtesy of tradingview.com
Silver didn't follow gold yet. Indeed, the price penetrated the dashed red trendline last October, but we didn't see the follow-through upside price action so far. Instead, the metal has been squeezed with a decreasing apex of the symmetrical triangle (highlighted in blue), one of the typical visual forms of consolidation.
It's good to trade on the breakout. The most expected action is upside penetration of the triangle amid rising a gold price. The target for the upside move is located at the EUR 18.75 level, calculated as a distance of the base (EUR 4.9, the widest part of the triangle) added to the break point. This is the area of the 2013 August high. In a less probable downside scenario the target is set at EUR 7.73 level.
Intelligent trades!
Aibek Burabayev
INO.com Contributor, Metals
Disclosure: This contributor has no positions in any stocks mentioned in this article. This article is the opinion of the contributor themselves. The above is a matter of opinion provided for general information purposes only and is not intended as investment advice. This contributor is not receiving compensation (other than from INO.com) for their opinion.