Both triggers were pulled in the precious metals since my last post about gold and silver. I hope it is interesting for you to see how you voted about the metals price action in that article.
Let’s start with the gold votes below.

Most of you (54%) thought that gold would resume the drop. It was a slight edge over the other option where you chose the completion of the pullback. Let’s check in the chart below to see what actually happened with the gold price since then.
Chart 1. Gold Daily: Second Leg Of A Pullback
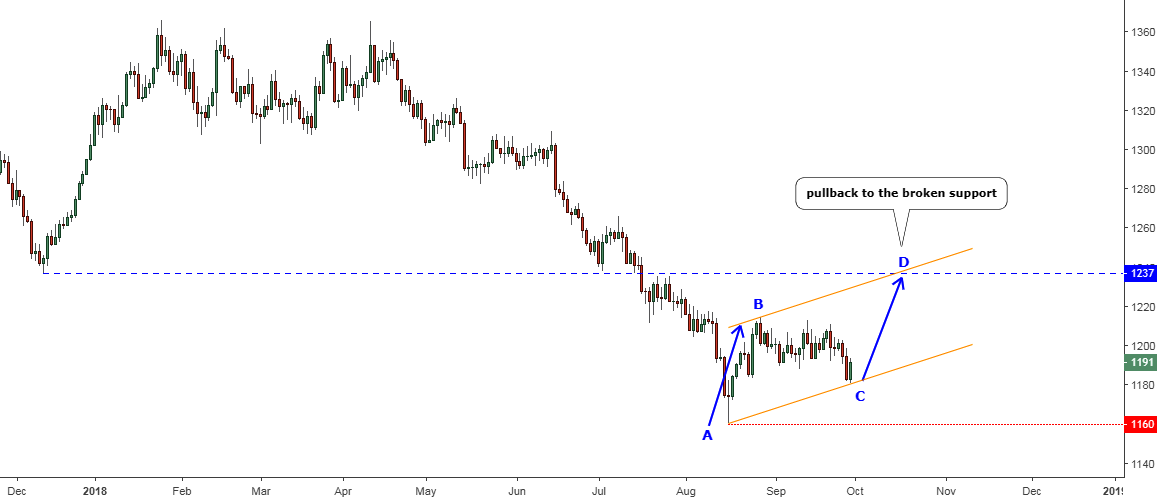
Chart courtesy of tradingview.com
The price of gold has finished the consolidation highlighted with the thin red down arrows in the earlier chart between the B and the C points of the blue AB/CD segments. The simple measurement pointed at the $1180 level, where I said the CD segment should start. Indeed, the gold has hit the $1181 low within the BC part and then bounced up towards the end of the last week to close at the $1191. This is the magic of simple math, which occurs in the charts again and again. Continue reading "Gold Bounced as Silver Broke Downtrend"