Back in September, I posted a Silver update with the very promising title, "The Time Has Come," where I suggested both target and time for this fading downside move. The target at the $13.7 level hadn’t been reached as buyers did not wait to buy on the dips and had followed Gold to the upside beyond $15, but the time goal (which I stressed in the title) worked out perfectly according to the Fibonacci time zone extension. The downtrend exhaustion appeared in September and it has been really wasting away as not only the low, but also the high of September have both been trapped in the shadow of August (margins have been highlighted in two black dashed parallel horizontal lines). Below the chart, I am going to expand on the prospects of the current reversal.
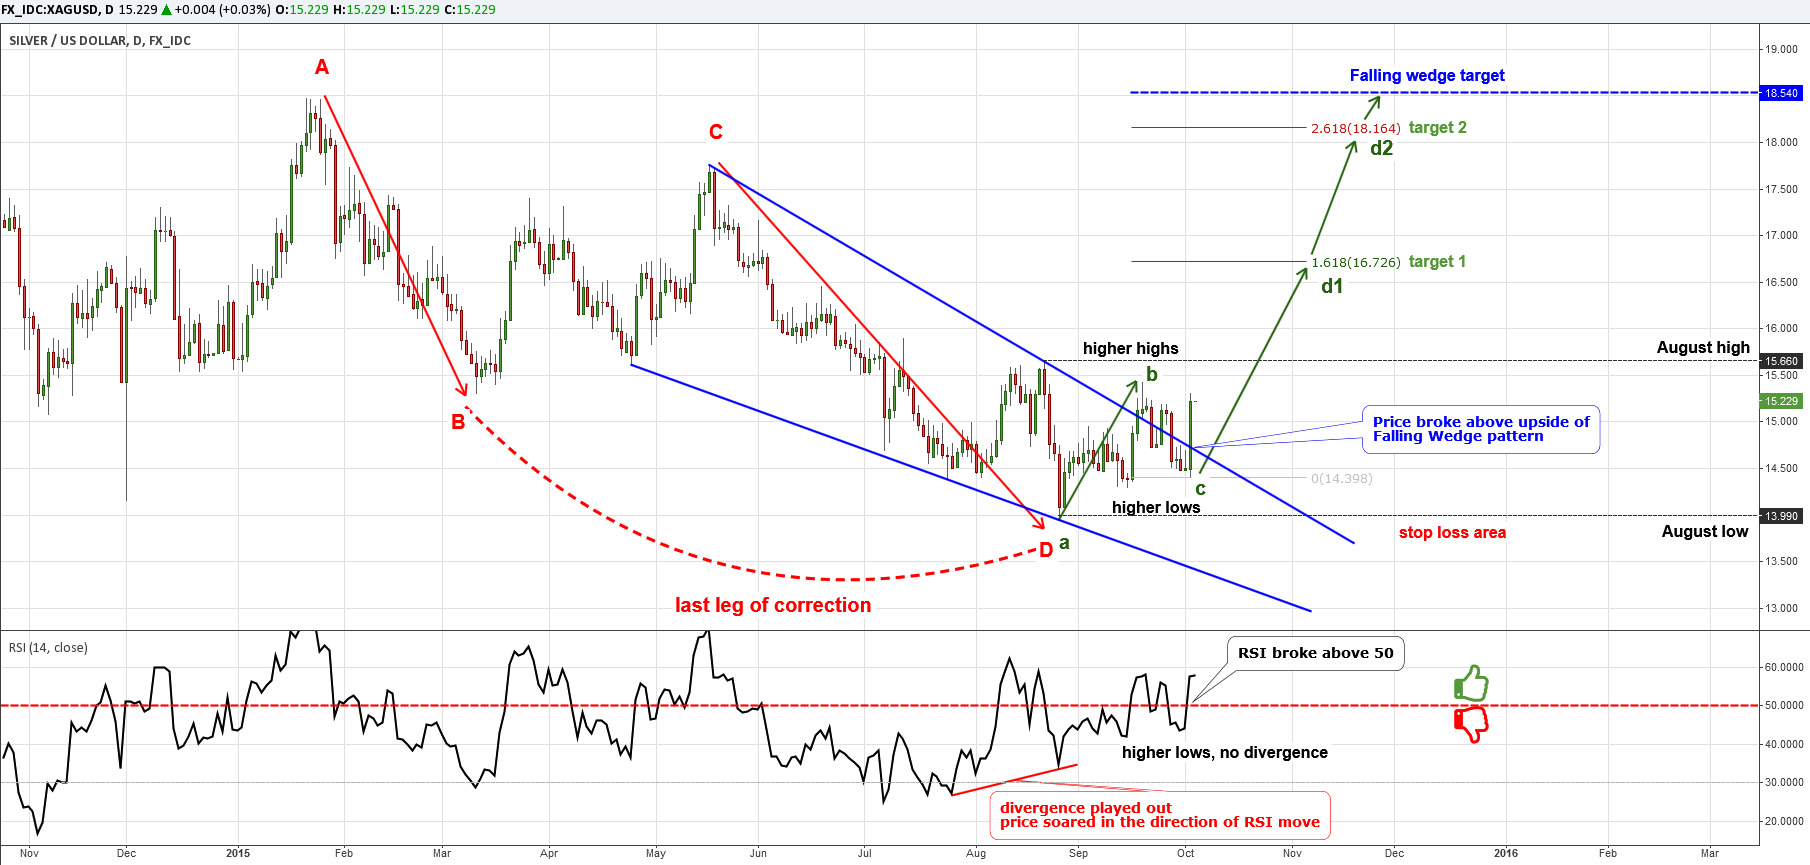
Chart courtesy of TradingView.com
Laozi said, “A journey of a thousand miles begins with a single step” and the above daily chart shows us important details that can’t be seen on the monthly chart. Here we can see the last steps of the previous “journey” down and the first “step” for the way up. Continue reading "Silver Update: Risk/Reward Ratio Favors Longs (1:4)"