Are The Markets Sending A Warning Sign?

After an incredible rally phase that initiated just one day before the US elections in November 2020, we’ve seen certain sectors rally extensively. Are the markets starting to warn us that this rally phase may be stalling? We noticed very early that some of the strongest sectors appear to be moderately weaker on the first day of trading this week. Is it because of Triple-Witching this week (Friday, March 19, 2021)? Or is it because the Treasury Yields continue to move slowly higher? What’s really happening right now, and should traders/investors be cautious?

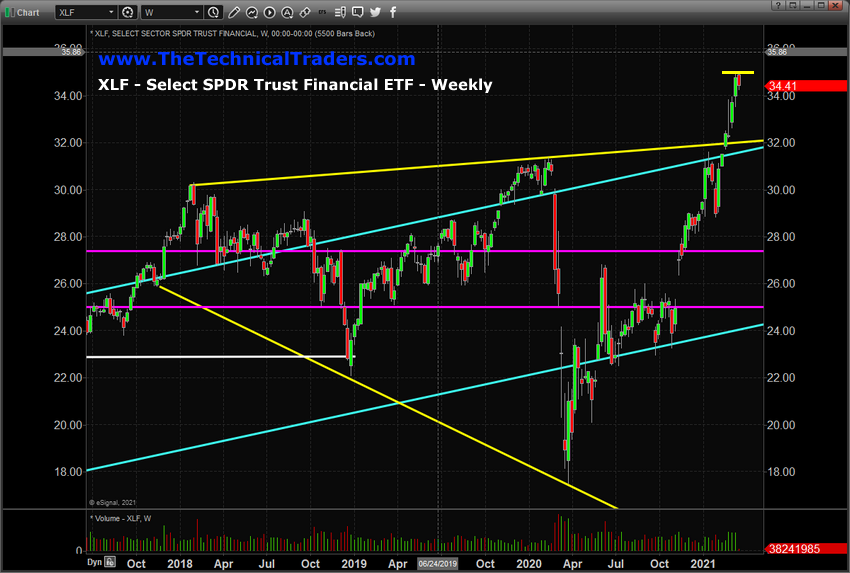
The following XLF Weekly chart shows how the Financial sector rallied above the upper YELLOW price channel, which was set from the 2018 and pre COVID-19 2020 highs. Early 2021 was very good for the financial sector overall; we saw a 40%+ rally in this over just 6 months on expectations that the US economy would transition into a growth phase as the new COVID vaccines are introduced.

We are also concerned about an early TWEEZERS TOP pattern that has set up early this week. If the price continues to move lower as we progress through futures contract expiration week, FOMC, and other data this week, then we may see some strong resistance setting up near $35.25. Have the markets gotten ahead of themselves recently? Could we be setting up for a moderately deeper pullback in price soon?

markets

The following SSO, ProShares S&P 500 ETF Weekly chart, shows a similar setup. Although the rally in the SSO is not quite the same range as the XLF, we see a solid TWEEZERS TOP pattern setup on the SSO chart over a period of many weeks. We also found the moderate weakness in the US indexes interesting this morning. Last week, we continued to see very strong buying trends. Today, we see those trends have almost vanished. Are the markets setting near highs waiting for some announcement or news to push them into a new trend? Continue reading "Are The Markets Sending A Warning Sign?"

Same Plan For Silver, Wake-Up Call For Gold

The U.S. dollar index (DXY) chart opens this update.

US Dollar Index

The plan posted at the beginning of this month played out amazingly accurate in the DXY chart. The dollar, indeed, moved to the upside hitting beyond the first target of 92.07, and it almost reached the second goal with a 1.272x multiplier at 92.72 mark. The maximum of 92.50 was established on March 8. This move has a sharper angle, and it reached the target earlier than the clone of the first move up.

This time I put more annotations to highlight all crucial things for education. The main question is whether the second move-up is over or not. We can see two distinct minor legs in the current move to the upside marked as (i) and (ii); the latter is larger than the former. Then the price reversed to the downside within a zigzag. This could be another minor consolidation ahead of the leg (iii) to the upside. Continue reading "Same Plan For Silver, Wake-Up Call For Gold"

World Oil Supply And Price Outlook, March 2021

The Energy Information Administration released its Short-Term Energy Outlook for March, and it shows that OECD oil inventories likely peaked at 3.210 billion in July 2020. In February 2021, it estimated stocks dropped by 62 million barrels to end at 2.955 billion, 80 million barrels higher than a year ago.

The EIA estimated global oil production at 92.17 million barrels per day (mmbd) for January, compared to global oil consumption of 95.89 mmbd. That implies an undersupply of 3.72 mmb/d, or 104 million barrels for the month. That implies non-OECD stocks dropped by 42 million barrels in addition to the OECD stock draw of 62 million barrels.

For 2021, OECD inventories are now projected to draw by net 91 million barrels to 2.942 billion. For 2022 it forecasts that stocks will draw by 26 million barrels to end the year at 2.949 billion.

Oil

The EIA forecast was made incorporates the OPEC+ decision to cut production and exports. According to OPEC’s press release January 5, 2021: Continue reading "World Oil Supply And Price Outlook, March 2021"

Options: Outperformance Despite Choppy Markets

An agile options-based approach is essential to navigating these choppy markets that we have witnessed thus far in 2021. Generating consistent monthly income while defining risk, leveraging a minimal amount of capital, and maximizing return on capital is the core of options trading. Options enable smooth and consistent portfolio appreciation without guessing which way the market will move. Options allow one to generate consistent monthly income in a high probability manner in all market scenarios. Over the past 10-plus months (May 2020 – March 2021), 225 trades were placed and closed. A win rate of 98% was achieved with an average ROI per winning trade of 7.5% and an overall option premium capture of 84% while outperforming the S&P 500. The performance of an options-based portfolio demonstrates the durability and resiliency of options trading to drive portfolio results with substantially less risk. This approach circumvented the September 2020, October 2020, and January 2021 sell-offs while outperforming the S&P 500, posting returns of 50.6% and 47.5%, respectively (Figures 1, 2, and 3).

Options
Figure 1 – Overall options-based performance compared to the S&P 500 from May 2020 – February 2021 Continue reading "Options: Outperformance Despite Choppy Markets"

Coinbase IPO Raises Concern About Bitcoin Long-Term

While the price of Bitcoin has been nothing more than incredible over the past year and completely blown me away, (and certainly proven me wrong a number of times when I have in the past stated that I did not think Bitcoin or any cryptocurrency was a "wise" investment), a new warning sign has made waves in the cryptocurrency industry and markets.

The warning comes from Coinbase prior to its upcoming initial direct listing, a different version of an initial public offering. In the report released by Coinbase for potential investors, the company listed several potential risks to its business. This is very common with public companies, even well past the time they have gone public. However, this is the first time we have seen these warnings from Coinbase, which generates the vast majority of its revenue from the trading of Bitcoin and Ethereum.

These risk factors include "disruptions, hacks, splits in the underlying network also known as 'forks,'" as well as developments in quantum computing and regulation that affect cryptocurrencies.

"The future development and growth of crypto is subject to a variety of factors that are difficult to predict and evaluate," the filing read.

Furthermore, the filing also mentioned "the identification of Satoshi Nakamoto, the pseudonymous person or persons who developed bitcoin," as a potential risk factor. It mentioned the transfer of Nakamoto's bitcoins, which some believe is worth around $30 billion. Bitcoin bulls fear that if Nakamoto is identified, it could harm bitcoin's decentralized nature, reputation, and overall security. Continue reading "Coinbase IPO Raises Concern About Bitcoin Long-Term"