Weekly Futures Recap With Mike Seery

Silver Futures

Silver futures in the December contract is trading higher for the 2nd consecutive trading session ending the week on a positive note up 40 cents at 18.20 an ounce after settling last Friday in New York at 17.57 up about 63 cents for the week hitting a four week high.

Dovish comments Thursday from ECB President Draghi bolstered the outlook for additional ECB stimulus measures, which was positive for the precious metals when he said the incoming data confirm "protracted weakness of the Eurozone economy.

I am recommending a bullish position if prices close above 18.00 while then placing the stop loss under the 10-day low standing at 17.18 as the risk is around $2,050 per 2 mini contracts plus slippage and commission as this market looks to test the contract high at 19.75 in my opinion.

I also have a bullish recommendation in copper as the whole sector looks to move higher. Silver prices are trading above its 20 and 100-day moving average as the trend has turned to the upside, so play this higher while making sure that you risk 2% of your account balance on any given trade.

TREND: HIGHER
CHART STRUCTURE: SOLID
VOLATILITY: HIGH

Continue reading "Weekly Futures Recap With Mike Seery"

Silver & Gold To Inform Dr. Copper

They call copper the metal with the Ph.D. in Economics. But these days Doctor Copper is little more than a quack in that regard, taking a cue from the metals whose interplay will be critical to deciding the coming macro for 2020 and the run-up to the next US election. Thus, they are the 3 Metallic Amigos, riding together but providing different signals at different times (this being nftrh.com, you will have to put up with the odd shtick from time to time).

Silver Gold Copper

As we have noted repeatedly, the Silver/Gold ratio takes it place alongside other indicators (like long-term Treasury yields, yield curve, TIPs ratios, inflation breakevens, etc.) of a would-be inflationary environment. When silver (more cyclical, commodity-like characteristics) rises vs. gold (more counter-cyclical, liquidity haven characteristics) it is a hint toward an inflationary macro.

A daily chart of silver/gold shows a constructive ratio at yesterday’s close and this morning in pre-market silver is +2.77% while gold is +.77%. The implication could well be an end to the current bull flag consolidation at the moving averages and the next upturn in silver/gold, the miners and possibly the inflation/reflation trades that tend to follow. Continue reading "Silver & Gold To Inform Dr. Copper"

Outlook For OPEC's Next Meeting

The next OPEC meetings are scheduled for early December. At issue is how they will deal with the outlook for the reduced demand for OPEC oil in 2020.

OPEC
Source: OPEC

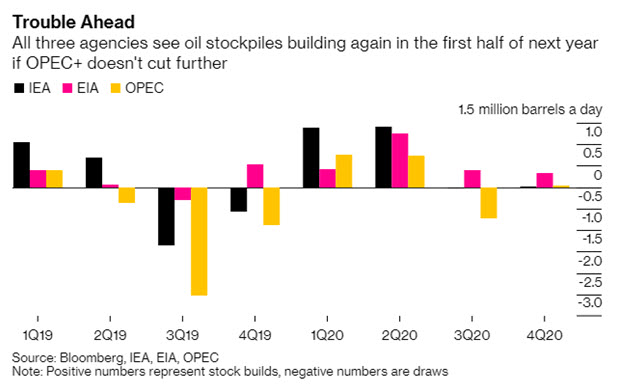
According to Bloomberg:

“The OPEC+ group of oil producers will need to make deeper output cuts when they meet in December. That’s the inescapable conclusion from the latest round of monthly reports published by the three big oil-forecasting agencies.”

OPEC

According to Reuters reporting, “Saudi Arabia, OPEC’s de facto leader, wants to focus first on boosting adherence to the group’s production-reduction pact with Russia and other non-members, an alliance known as OPEC+, before committing to more cuts, the sources said…A second OPEC source said: “Of course deeper cuts are an option, but some things should happen before that. The rest of the OPEC+ countries will not cut deeply if Iraq and Nigeria don’t comply 100%.”

Supply Adjustments

OPEC released a table in January showing the “Voluntary Adjustment” to “Reference Production,” which result in the “Voluntary Production Level” for the OPEC and non-OPEC participants. Libya, Iran, and Venezuela were exempted.

OPEC

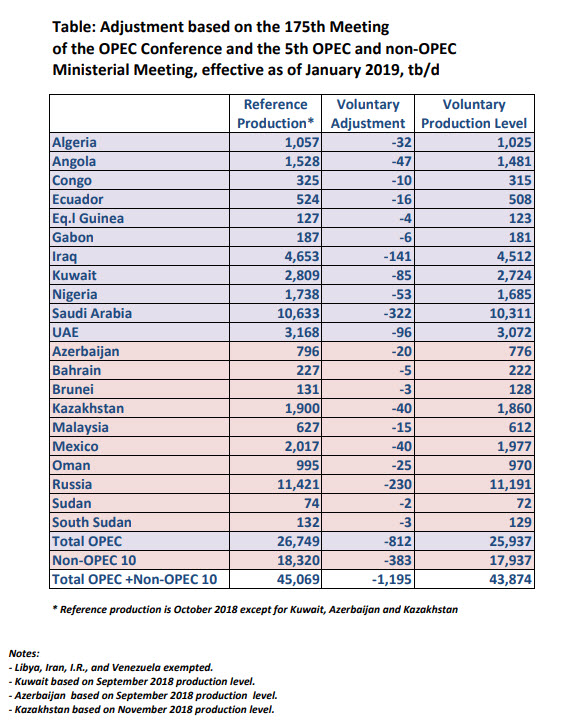
As shown above, OPEC production “quotas” for the other OPEC members totaled 25.937 million barrels per day. For August 2019, prior to the attack on Saudi facilities in September, OPEC production totaled 29.8 million barrels per day.

OPEC

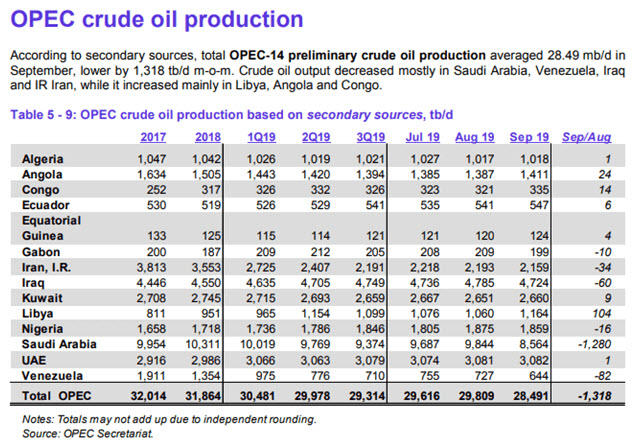
Using the 25.937 million as a base, and adding actual September production of 2.159 for Iran, 1.164 for Libya, and .644 for Venezuela gives a total of 28.894. Demand for OPEC oil is projected (by OPEC) to be 29.6 in 2020, so it requires an additional cut of .294 million barrels per day.

Saudi Arabia has been willing to cut that much below its target. So the key for them is getting the biggest over-producers to comply, which is Nigeria, Iraq, and Russia.

Nigeria

Nigeria will make cuts to its crude oil output to comply with OPEC output targets, Mele Kolo Kyari of the Nigerian National Petroleum Company (NNPC) said.

According to OPEC’s numbers, Nigeria had pumped 1.859 in September, 175,000 b/d beyond its quota.

However, there may be a bigger problem brewing for the future. Kyari said that Nigeria hoped to raise oil production to about 3 million bpd in the next 2 to 3 years.

Iraq

Iraq will be fully compliant by October with agreed oil output cuts under an OPEC-led supply deal, and Baghdad’s reduction will amount to 175,000 barrels per day (bpd), Oil Minister Thamer Ghadhban said.

Iraq produced 4.724 in September. Its quota is 4.512. So the difference is actually a little more than 200,000 b/d.
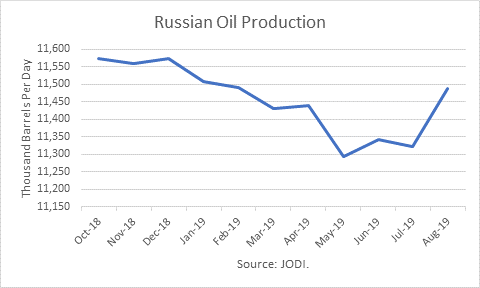
Russia

According to numbers reported by the Joint Organizations Data Initiative (JODI), Russian production in August was only 86,000 b/d lower than last October, the reference month. The country had promised to cut its output by 230,000 b/d.

Russian oil production

Conclusions

Thanks to the effects of sanctions on Iran and Venezuela, OPEC’s production cuts are far greater than had been planned. And so the task of lowering production to meet demand in 2020 is doable, assuming those overproducing actually do comply, and Saudi Arabia is willing to keep underproducing.

However, the opposite side of the coin is the risk that U.S. sanctions on Iran will be lifted prior to the U.S. presidential election next year. If they are, OPEC will have upwards of another 1.7 million barrels to cut to make room for Iran, and that would be very challenging, at best.

Check back to see my next post!

Best,
Robert Boslego
INO.com Contributor - Energies

Disclosure: This contributor does not own any stocks mentioned in this article. This article is the opinion of the contributor themselves. The above is a matter of opinion provided for general information purposes only and is not intended as investment advice. This contributor is not receiving compensation (other than from INO.com) for their opinion.

Revisiting "Black Monday - 1987" - Oct. 19, Part 1

Back in the day, for those of you that are old enough to remember and have experienced one of the most incredible trader psychology driven stock market decline in recent history.

The difference between “Black Monday” and most of the other recent stock market declines is that October 19, 1987, was driven by a true psychological panic, what we consider true price exploration, after an incredible price rally.

It is different than the DOT COM (2001) decline and vastly different than the Credit Market Crisis (2008-09) because both of those events were related to true fundamental and technical evaluations. In both of those instances, prices have been rising for quite some time, but the underlying fundamentals of the economics of the markets collapsed and the markets collapsed with future expectations. Before we get too deep, be sure to opt-in to our free-market trend signals newsletter.

Our researchers believe the setup prior to the Black Monday collapse is strangely similar to the current setup across the global markets. In 1982, Ronald Reagan was elected into his second term as the US President. Since his election in 1980, the US stock market has risen over 300% by August 1987.

Reagan, much like President Trump, was elected after a long period of US economic malaise and ushered in an economic boom-cycle that really began to accelerate near August 1983 – near the end of his first term. The expansion from the lows of 1982, near 102.20, to the highs of 1987, near 337.90, in the S&P 500 prompted an incredible rally in the US markets for all global investors.

Black Monday

This is very similar to what has happened since 2015/16 in the markets and particularly after the November 2016 elections when the S&P500 bottomed near 1807.5 and has recently set hew highs near 3026.20 – a 67.4% price rally in just over 3 years. Continue reading "Revisiting "Black Monday - 1987" - Oct. 19, Part 1"

Palladium Reached Double Resistance

Back in March, I shared with you an updated chart for palladium. It hit the record high of $1553 by that time to become the most precious metal, and it still is.

Every time the price makes a record high, there is a chance for a reversal. In that post, I measured the AB/CD segments of the upside moves on the chart and both short term and long term measurements showed the equality, which meant the possible exhaustion of a Bull Run. I didn't try to guess the top that time and asked your opinion. Below is the distribution of your votes.

Palladium

Most voters chose the $1600-2000 range for the top of the palladium price, which meant that the established new record should be updated to the upside. Your prediction amazingly came true, but this bet wasn't that obvious as it played out only five months later, when the metal refreshed the all-time high at $1601 in July as only then the price entered the forecasted range. Last week the price did it once again to hit a new record high of $1750, confirming your accurate prophecy. Congratulations!

Let's see what happens with the palladium futures these days in the weekly chart below. Continue reading "Palladium Reached Double Resistance"