Impact Of Fed Rate Hike: June vs. September

Lior Alkalay - INO.com Contributor - Forex


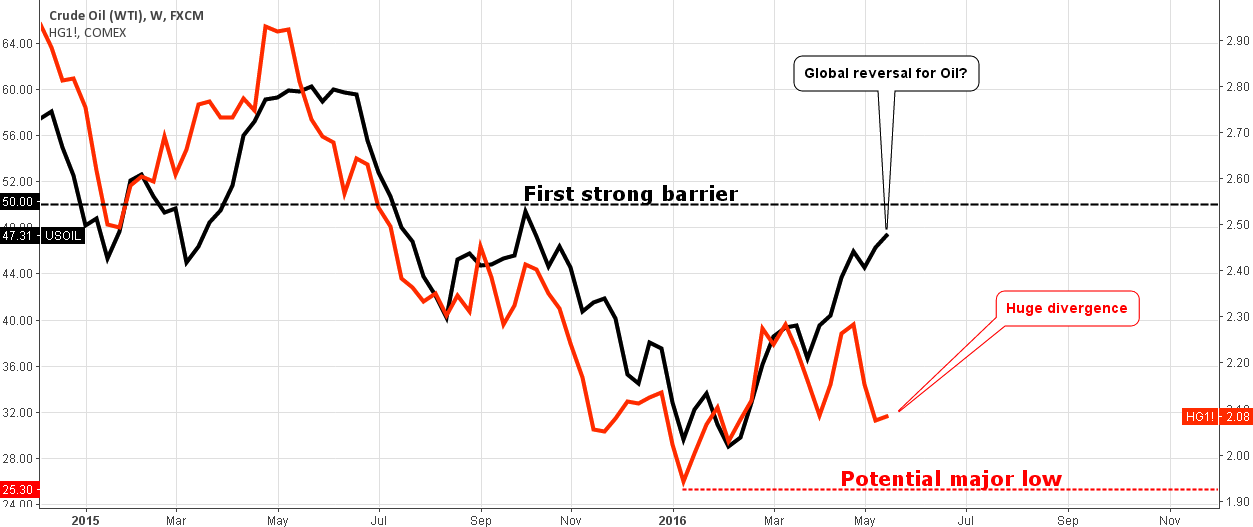
The Fed dropped a bomb this past Wednesday when it released the latest FOMC minutes—a rate hike in June is possible. Weak US growth in the first quarter of the year and a slowdown now, coupled with nonfarm growth below 200K jobs might have suggested a more tamed statement. Markets responded to the surprise with a selloff in Treasuries and equities and a surge in the Dollar. And yet, despite the explicit mention of June, a rate hike in September seems more likely.

Just like the December 2015 rate hike, the Fed softens the blow by throwing out the possibility of a rate hike before the conditions are actually ripe for one. By the time the Fed actually lifts rates, the money market and the bond markets have adjusted and the shock is minimal. Continue reading "Impact Of Fed Rate Hike: June vs. September"

Copper Bites The Dust Behind Strong Oil

Aibek Burabayev - INO.com Contributor - Metals


All of the top commodities have rebounded amid the dollar's weakness recently, but copper didn't follow the pack to make gains. I think we should take a chance as this misbehavior will not last for long.

Chart 1. Copper-Oil Correlation: Huge Divergence!

Copper-Oil Correlation
Chart courtesy of tradingview.com

The crude oil is very strong these days, although last time we have been witnessing its comparative weakness to copper. It looks like the Double Bottom reversal pattern is still making the game for oil with the first strong barrier at the $50 level.

This time, copper overreacted to the short-lived drop of crude hitting the $2.06 area, and this gap that we can see on the chart above kept at the following strong rebound. And then another weird thing happened – crude oil had a minor pullback and continued its upward move while copper overreacted again down to the previous low area at $2.06, this time with even larger divergence. Now look at the left part of the chart, the current gap reminds me the one-year-old situation – oil had stalled at the end of May 2015 while copper overcame it with a new high and then it dropped sharply to run down crude. Therefore, there is a high probability of copper catching up soon with the current oil price corresponding to $2.40-2.50 copper price levels.

Let's look at the copper chart below to find it out. Continue reading "Copper Bites The Dust Behind Strong Oil"

Will CVS Continue To Deliver Sustained Growth?

Noah Kiedrowski - INO.com Contributor - Biotech


Introduction

CVS Health Corporation (NYSE:CVS) had recently capped off a fantastic 2015 performance in several metrics (EPS growth, revenue, dividends, share buybacks and acquisitions) that drive shareholder value. I posted that CVS presented a compelling investment opportunity in the healthcare space. This premise was based on the fact that CVS has been highly acquisitive, continues to deliver robust growth, growing its dividends over time and has an aggressive share buyback program. CVS recently reported a record year in 2015 and continues to drive and position itself for long-term success. With its recent acquisitions and partnerships, specifically, the acquisition Target’s pharmacies and Omnicare will significantly expand its footprint and ability to dispense prescriptions to the general public and in assisted living and long-term care facilities that serve the senior patient population. As the United States continues to absorb an aging population alongside growing overall healthcare costs, more specifically prescription drug costs, CVS looks poised to benefit and continue to outperform the broader market. 2015 was a record year for CVS and with a 21% boost in its dividend payout only underscores this premise. The release of its Q1 2016 earnings reiterates this premise and this company is maintaining its growth story. I content that CVS will continue to deliver sustained growth and position itself for long-term success to drive shareholder value. Continue reading "Will CVS Continue To Deliver Sustained Growth?"

Gold & Silver Daily: Ladies And Gentlemen, The Bull Flag!

Aibek Burabayev - INO.com Contributor - Metals


Today when I saw that precious metals started to rise after a correction I detected on the charts my favorite pattern called the Bull Flag. This pattern can change the targets depicted in my earlier gold and silver posts, better say enrich them.

Chart 1. Gold Daily: Beyond 1300!

Daily Gold Chart
Chart courtesy of tradingview.com

Gold is in the blue multi-month uptrend. The angle is not as sharp as it was at the start of the year, but it still can take gold to fresh highs. Continue reading "Gold & Silver Daily: Ladies And Gentlemen, The Bull Flag!"

The Dollar Index: Make Or Break?

Aibek Burabayev - INO.com Contributor - Metals


In this post, I would like to offer a global outlook for the gauge of the most financial assets, for the US dollar via its index DXY.

It is important to understand the global trend for the dollar to plan our precious metals strategy. I've included four charts below with different periods of observations and you can judge for yourself what you are after.

Chart 1. Dollar Index Monthly (1985-2016): Looks Bad!

Dollar Index Monthly
Chart courtesy of tradingview.com

On the monthly chart above, we see that the dollar dropped from the 125+ levels, then made a correction to the blue A point at the 121 level. After that, from 2001, we saw another massive sell-off of 51 points down to the 70 level in he notorious 2008. Continue reading "The Dollar Index: Make Or Break?"