Facebook Is Inexpensive

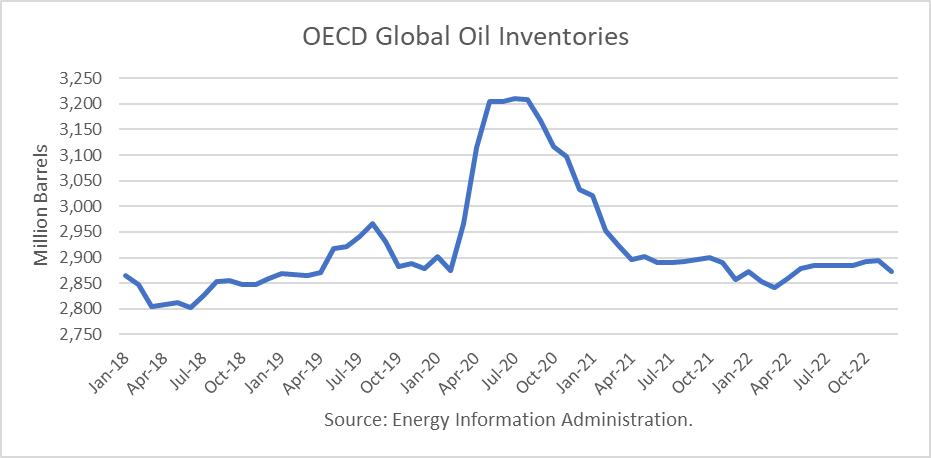
Facebook (FB) continues to demonstrate its ever-expanding and massive moat in the social media space. Facebook’s core social media platform, in combination with its other properties such as Instagram and WhatsApp, continue to grow while expanding margins and unlocking revenue verticals. Despite being faced with several public relations challenges over the past couple of years (i.e., Cambridge Analytica, coordinated boycotts, government inquiries into privacy, jumbled earnings calls, and anti-competitive testimonies), Facebook has triumphed to all-times as of late. Facebook had to contend with scaled back advertising spending amid the COVID-19 pandemic in conjunction with the public relation issues. Facebook continues to grow across all business segments, with its user base continuing to expand slowly. Facebook’s moat is undeniable, and any meaningful sell-off like the recent Fed-induced systemic weakness could provide an entry point for the long-term investor. Although near all-time highs, Facebook is inexpensive relative to its technology cohort.

Advertising Boycotts Falter

Facebook faced a very public onslaught of companies joining an advertising boycott across its social media platforms. However, its latest earnings reports suggest that this effort may have been largely symbolic and effectively inconsequential to its revenue and growth numbers. The advertising boycott had grown to roughly a thousand groups and multinational companies. This presented a unique challenge in which the company remediated and diverted more spending to compliance/security aspects which had already swelled post-Cambridge Analytica, and other platform vulnerabilities were exposed. The magnitude of this boycott seems to have been an inconsequential influence on the stock price. This public relations challenge was managed and posed minimal risk to the company’s valuation moving forward. Continue reading "Facebook Is Inexpensive"

World Oil Supply And Price Outlook, June 2021

The Energy Information Administration released its Short-Term Energy Outlook for June, and it shows that OECD oil inventories likely peaked at 3.210 billion in July 2020. In May 2021, it estimated stocks rose by 4 million barrels to end at 2.901 billion, 298 million barrels lower than a year ago.

The EIA estimated global oil production at 95.02 million barrels per day (mmbd) for May, compared to global oil consumption of 96.22 mmbd. That implies an undersupply of 1.20 mmb/d, or 37 million barrels for the month. Given the increase in OECD stocks, non-OECD stocks dropped by 41 million barrels.

For 2021, OECD inventories are now projected to draw by net 149 million barrels to 2.877 billion. For 2022 it forecasts that stocks will build by 80 million barrels to end the year at 2.957 billion.

OECD Global Oil Inventories

The EIA forecast was made incorporates the OPEC+ decision to cut production and exports. According to OPEC’s press release June 1, 2021: Continue reading "World Oil Supply And Price Outlook, June 2021"

Gold & Silver: Fed Boosted The Dollar

Last Thursday, the dollar rallied, reaching a two-month high versus major currencies, a day after U.S. Federal Reserve shocked markets by projecting a hike in interest rates and an earlier end to emergency bond-buying.

Daily US Dollar Chart

The price broke above the black dotted trendline resistance, which does not look like a minor correction. Instead, I think this is an extension of a large retracement of the entire move down that started in March of 2020.

The market could build the second leg of this large consolidation marked with an orange color. I highlighted the last leg with a green zigzag to the upside. The current leg up could repeat the same two-movement structure, so I built the orange zigzag. The first move within a second leg up could be over. I expect the upcoming pullback to retest the broken trendline resistance. After that, the retracement could resume and hit the top of the first leg at 93.4. Continue reading "Gold & Silver: Fed Boosted The Dollar"

What Happened To The Commodity Markets?

The commodity markets were absolutely crushed Thursday afternoon, experiencing some extreme losses that I have not witnessed for quite some time. We saw -5% to -10% declines across the board. The Federal Reserve announced that they would start to raise interest rates next year as that sent the momentum to the downside as investors did not like to hear that information as higher rates are bearish commodity prices.

I have been trading these markets for around 30 years, and I have seen a sharp sell-off before as we may have gotten a little ahead of ourselves. However, I still believe you take advantage of massive sell-offs as the long-term secular bullish trends are still intact.

If you have been following my previous blogs, you understand that I try to risk around 2% of my account balance on any given trade, as this is an excellent theory. All you have to do is look at what happened over the last couple of days, especially in the metals and the grains, and if you do not follow that rule, you could lose a substantial amount quickly.

Sugar Futures

Sugar futures in the October contract settled last Friday in New York at 17.67 while currently trading at 16.76, down another 90 points continuing its bearish momentum as prices have now traded lower five out of the last six trading sessions. The commodity markets across the board are taking a beating this week because interest rates could rise in the coming year ahead. Continue reading "What Happened To The Commodity Markets?"

Weekly Stock Market Forecast

This week we have a stock market forecast for the week of 6/20/21 from our friend Bo Yoder of the Market Forecasting Academy. Be sure to leave a comment and let us know what you think!

The S&P 500 (SPY)

SPY Daily Chart- Stock Market Forecast

Although it wasn't precise enough to base a new position on, the historical tendency for a "dead and drifting market" to produce a big increase in volatility came true this time yet again.

As the market expands to the downside, there are two test points that I will be watching with great interest. The first is the trendline support which is relatively minor just above the $412 per share area. The second will be the area of support back near the recent lows. As these areas are tested, I will be taking measurements of the supply and demand forces at that time and will be in a better position to make an accurate forecast.

The forecasting tools that I use give me incredible amounts of clear and precise information about the supply and demand forces that are impacting the market right now. By taking measurements at specific intervals, I can forecast where those supply slash demand imbalances are likely to resolve. It's kind of like the process meteorologists use in order to predict the track of a hurricane. They look at the radar to see where the hurricane is and then look at how that picture changes over time in order to interpolate speed, velocity, and likely areas of landfall. Continue reading "Weekly Stock Market Forecast"