
Early trading on January 4, 2019, saw Gold reach just above $1300 per ounce – confirming our price target from our research and posts on November 24, 2018. The importance of this move cannot be under-estimated. Traders and investors need to understand the recent rally in the metals markets are attempting to alert us that FEAR is starting to re-enter the market and that 2019 could start the year off with some extended volatility.
Our research has shown that Gold will likely rotate between $1270~1315 over the next 30~60 days before attempting to begin another rally. Our next upside price target is near $1500. We will continue to post articles to help everyone understand when and how this move will happen. We expect Gold to rotate near the $1300 level for at least another 30 days before attempting another price rally.
Pay attention to the Support Zone on this Daily Gold chart and understand that price rotation is very healthy for the metals markets at this point. A reprieve in this recent Gold rally would allow the start of 2019 to prompt a moderate rally in the US stock market as well as allow a continued capital shift to take place. As capital re-enters the global equities markets, investors will be seeking the best investment opportunities and safest environments for their capital. Our belief is that the US stock market will become the top-tier solution for many of these investments. Continue reading "What's Next For Gold?"
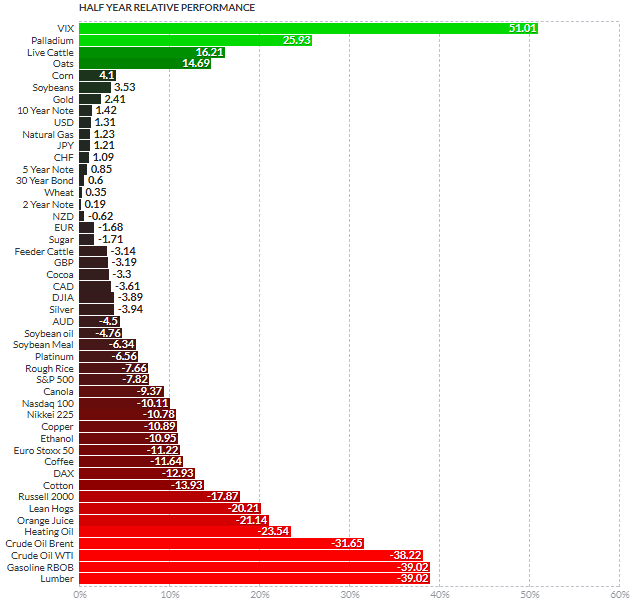
 I was going to look around to see if I could find a media article out there (complete with a TA trying to sound really important) that would be appropriate to be made fun of in our little Men Who Stare at Charts series. But then I decided to create my own chart, stare at it a little, post it and talk about it (hopefully not too self-importantly).