Those who hope tell themselves - one day the tide will turn. I think a lot of people are either long or they’re not and were waiting for the rise of the top metals. Below are fresh charts which could help us to understand where we are and when the tide will turn higher.
Chart 1. Gold Daily: Watch The Breakup For Reversal
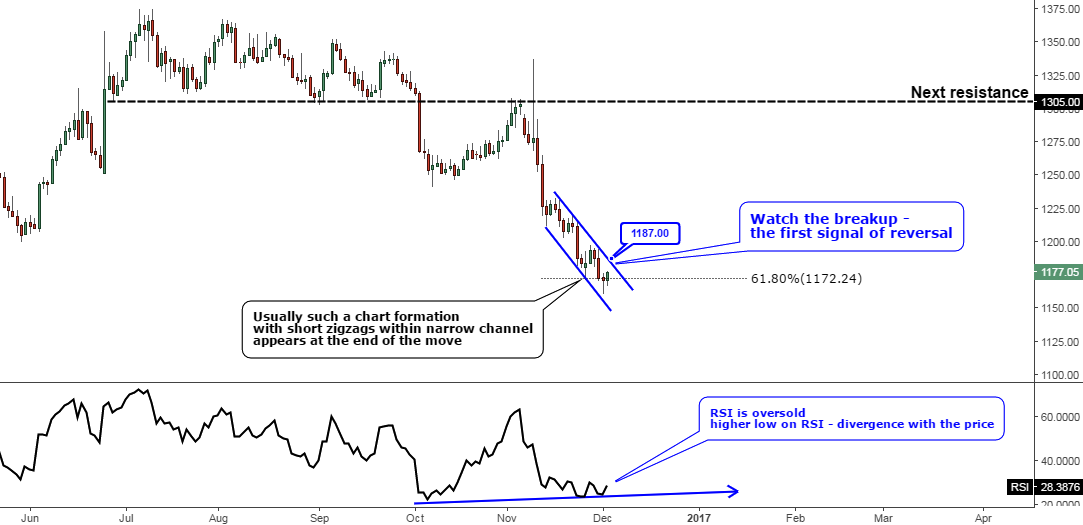
Chart courtesy of tradingview.com
I’ve written quite a lot in my previous posts about the tricky nature of corrective structures which have unpredictable outcomes. But the more time we spend inside of it, the higher are the chances that the situation becomes clearer. Continue reading "Gold & Silver: Silver Is The First Up"