Truth Is, It's Not Just About Fueling EVs

“The following is an excerpt from Tim Snyder’s “Weekly Quick Facts” newsletter. Tim is an accomplished economist with a deep understanding of applied economics in energy. We encourage you to visit Matador Economics and learn more about Tim. While there, you can sign up for his completely free Daily Energy Briefs and Weekly Quick Facts newsletters.”

Truth, once again leads our headlines? Over the last two weeks, I have been busting my hump to prepare a presentation for an energy group, having a conference and I really dug deep to pull the data that really made sense for those who don’t ever see all the facts.

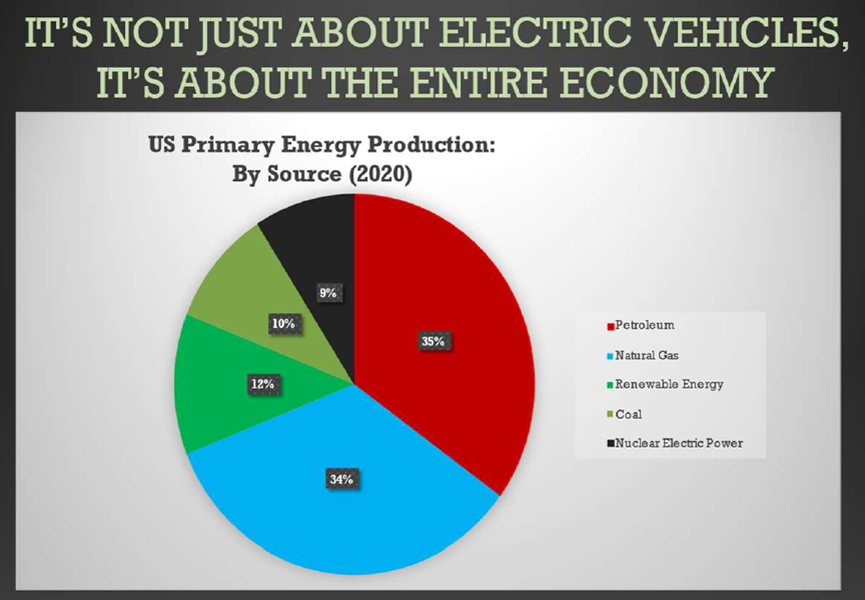
I went to 25 or 30 different sources and grabbed “Snippets” of data to use in my presentation and a solid theme began to develop. The theme was this, it’s not just about the EVs, it’s about the entire energy balance and how many BTUs it would take, to replace fossil fuels in the entire US economy. Here’s how much we produce by sector, each year.

Demand in Quads, by Sector. Continue reading "Truth Is, It's Not Just About Fueling EVs"

Situation With Russian ETFs Highlights A Bid Risk

As the world watches Russian troops attack Ukraine, global leaders impose sanctions on Russia, as opposed to sending military personnel to assist the Ukrainian people with repelling Russian forces. Over the long term, these sanctions may impose more damage on Russia and the companies that lay within its borders than troops perhaps could. It is unknown, though, at this time, what the total economic toll of these sanctions will be on Russia and its economy; however, most analysts feel it will be substantial.

But what may be more destructive long-term for Russia is not what is happening to the country today but what may not happen to Russia in the future, new development and investing. The Russian stock market shut down shortly after Russian troops entered Ukraine. But not only did Russian stocks stop trading in Russia, but also in the US and other markets worldwide. Furthermore, countless foreign businesses that had operations in Russia have pulled out and no longer operate their stores, shops, and factories in the country.

So, both the individual business investments have walked away from Russia, and the world financial markets have essentially cut Russia off from capital. This lack of capital both from the smaller individual standpoint and the larger global point of view, could put Russia in a tight spot in years to come as the country and its businesses may struggle to grow and re-invest in themselves without the support of foreign investment. Continue reading "Situation With Russian ETFs Highlights A Bid Risk"

Gold Has Repeated Bullish Pattern

Back in February, I shared with you an updated monthly chart of gold futures with a completed Cup & Handle pattern just ahead of a potential breakout above the preset trigger.

Most readers supported the ambitious target of $2,800 for that exact pattern. So let's check on the chart below and see how it plays out these days.

Monthly Gold Futures Chart

Indeed, the bullish impulse gathered enough power to break above the resistance that acted as a trigger for this pattern. The volume increased significantly, as it was required to overcome the barrier and confirm the breakout. The RSI has supported that rally as it turned north, either. Continue reading "Gold Has Repeated Bullish Pattern"

Bitcoin Tested By Uncertainty... And Wins!

I probably don’t have to tell you that no matter where you turn these days, there’s one thing you can be certain of.

Uncertainty.

That’s right. There’s a ton of uncertainty no matter where we turn. And that’s true, as a matter of fact, in our daily lives: While we try to make things as predictable and certain as possible, in the end, we’re all just flat-out exposed to uncertainty.

It’s also true when it comes to our investments in gold (GC1), stocks (SPX), tech (NASDAQ), and Bitcoin (BTC). In fact, that uncertainty is even more at play. See for yourself.

Bitcoin Daily Chart

As you can see from this chart of gold, stocks, and tech, every asset has had its fair share of volatility over the past year. In fact, the performance of gold, stocks, and tech have ranged from 18% to the upside (gold) to -9% to the downside (tech) during the last one-year performance period. Lumping all those assets together, that’s a net swing of 27% from top to bottom. Whew!
But when you throw Bitcoin into the mix, it’s clear that BTC makes that uncertainty look like a walk in the park. Why? Because over the same one-year performance period, Bitcoin has ranged from 13% to the upside (Nov 2021) to -50% to the downside (July 2021). That’s a net swing of 63% from top to bottom or about 2.3 times the performance volatility of gold, stocks, and tech. Continue reading "Bitcoin Tested By Uncertainty... And Wins!"

Options-Based Portfolio Screening Tool

Controlling the overall systemic risk of a portfolio is essential as the markets continue to grapple with inflation, a rising interest rate environment, supply chain challenges, and the Russian/Ukraine conflict.

Controlling volatility while generating in-line or superior returns relative to the market is the goal of an options-based portfolio. An option-based strategy is achieved via a blended approach of options, long stock positions, and cash. Options alone cannot be the sole driver of portfolio appreciation; however, they can play a critical component in the overall portfolio construction while keeping volatility in check (Figure 1).

Generating consistent monthly income while defining risk, leveraging a minimal amount of capital, and maximizing returns is the core of an options-based portfolio strategy. They can enable smooth and consistent portfolio appreciation without guessing which way the market will move. Options enable the possibility to generate consistent monthly income in a high probability manner in various market scenarios. An options-based portfolio provides durability and resiliency to drive portfolio results with substantially less risk. Over the previous 2-year period, the portfolio strategy has consistently outperformed the Dow Jones with reduced volatility (Figure 1).

Options Trading

Figure 1 – Previous 24-month period of overall returns for the options-based portfolio strategy relative to the Dow Jones. All option and stock trades executed in the options-based portfolio is available via the Trade Notification Service

Options Screening Tool

Using basic technical indicators and key dates can aid in trade type selection, such as covered calls, put spreads, call spreads, or iron condors (Figures 2 and 3). Continue reading "Options-Based Portfolio Screening Tool"