DOW Erases 2020 Losses With Strong Close

Stocks closed higher on the day Friday to end another record week for stocks, with the DOW erasing its losses for 2020 by gaining +0.6% to close at 28,653.87. After Friday's close, the DOW was now up +0.4% for 2020, its first foray into positive territory for the year since February.

The S&P 500 gained +0.7% to close at 3,508.01. It's the first-ever close above 3,500 for the index. The NASDAQ climbed 0.6% to end the day at 11,695.63.

For the week, the DOW rose +2.6% for its third weekly gain in four weeks. The S&P 500 and NASDAQ both notched five-week winning streaks, rising over +3% each. This marks the S&P 500's first five-week winning streak since late 2019. It's also the longest run for the NASDAQ since a six-week win streak that ended in January. Continue reading "DOW Erases 2020 Losses With Strong Close"

Analysis Of The US Petroleum Inventories

According to the Energy Information Administration, US petroleum inventories (excluding SPR) dropped by 2.6 million barrels last week to 1.444 billion, whereas SPR stocks dropped by 1.6 million barrels. Total stocks stand 152 mmb above the rising, rolling 5-year average and about 133 mmb higher than a year ago. Comparing total inventories to the pre-glut average (end-2014), stocks are 385 mmb above that average.

Total US Oil Stocks

Crude Production

Production averaged 10.7 mmbd last week, down unchanged from the prior week, and 10.875 mmbd over the past 4 weeks, off 11.4 % v. a year ago. In the year-to-date, crude production averaged 11.974 mmbd, off 1.1 % v. last year, over 200,000 b/d lower.

US Crude Production

Other Supply

I have previously noted in an article how the “Other Supply,” primarily natural gas liquids and renewables, are integral to petroleum supply. The EIA reported that it dipped 3,000 b/d v. last week at 6.639 mmbd. The 4-week trend in “Other Supply” averaged 6.746 mmbd, off 6.7 % over the same weeks last year. In YTD, they are unchanged from 2019. Continue reading "Analysis Of The US Petroleum Inventories"

Gold ETFs Setting New Highs

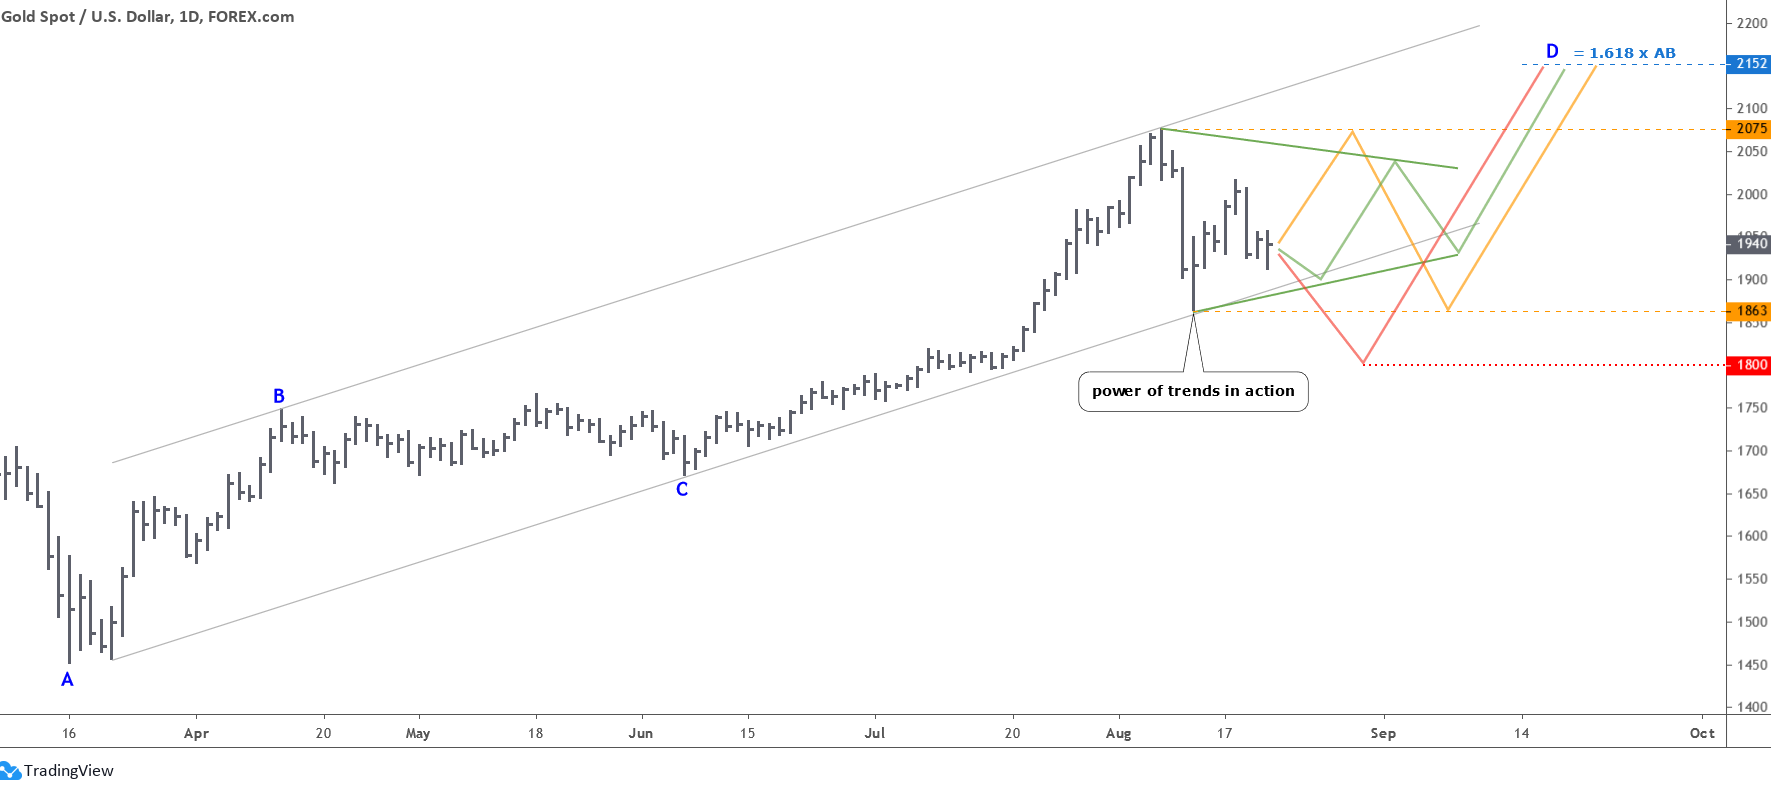
During the final days of July, Gold hit new all-time highs just below $2,000. The record run higher for the precious yellow metal, and for most of the precious metals has been in large part caused by the worldwide pandemic. As investors become nervous about the future, many find safe harbor in gold and other hard asset metals.

The bull market will likely continue as long as the pandemic and world economies struggle to gain traction. But, if we see a vaccine that protects against Covid-19, the price of gold will likely begin to fall as investors move back away from safe investments and back into equities, bonds, and other higher-risk – higher growth investments. When the rally ends, well, that’s, of course, the trillion-dollar question and one that I can’t help with. However, I can point you in the right direction of what to invest in regardless of which way you think the price is headed.

The big dog in the gold Exchange Traded Fund world is the SPDR Gold Trust (GLD). GLD has over $77 billion in assets under management and has been in existence since 2004. The fund charges a 0.4% expense ratio and has an average daily dollar amount volume of just over $1.76 billion, meaning it typically has liquidity. GLD tracks the gold spot price using gold bars held in vaults in London. This is an excellent option for anyone who wants the protection of gold but doesn’t want the hassle of buying actual gold bars.

The only big downside to GLD is that one share will cost you roughly $185. But there is a solution to that problem, and it’s called the SPDR Gold MiniShares Trust (GLDM). GLDM is essentially the same thing as GLD, but it holds 1/10th as much gold per share as GLD, and therefore each share costs less. As of this writing, GLD is $184.98 per share, while GLDM is $19.61 per share. GLDM tracks the spot price of gold the same as GLD, but it also has a lower expense ratio of just 0.18%. It also has much fewer assets under management of just $3.22 billion and therefore is less liquid for large orders. But again, if you want to place a large order, go with GLD. GLDM is designed for the small retail investor, not the large funds that need exposure to gold. Continue reading "Gold ETFs Setting New Highs"

Options - How To Capture Over 100% Premium

How is it possible to capture more premium than what you sold an option contract for? The answer lies in the manner in how you construct your option trade (i.e., put spread vs. custom put spread). A custom put spread leverages a minimal amount of capital, defines risk, and maximizes the return on investment while enabling traders to capture greater than 100% of the option premium. Custom put spreads are ideal when engaging in options trading for many reasons. This type of trade is great to layer into a long-term successful overall options strategy which includes risk-defining trades, staggering expiration dates, trading across a wide array of uncorrelated tickers, maximizing the number of trades, appropriate position allocation, and always being an option seller to bring premium income into the portfolio continuously.

Using a combination of custom put spreads and put spreads, a total of 91 trades were placed in May, June, July, and thus far in August as the markets rebounded after the COVID-19 lows. During this timeframe, all 91 trades were winning trades to lock-in a 100% option win rate with an average income per trade of $185, an average return on investment (ROI) per trade of 7.5%, and overall premium capture of 99.4%. An options-based portfolio can offer the optimal balance between risk and reward while providing a margin of downside protection with high probability win rates. As the market continues to rebound, optimal risk management is essential when engaging in options trading as a means to drive portfolio performance (Figures 1, 2, and 3).

Options
Figure 1 – Average income per trade of $185, the average return per trade of 7.5% and 99.4% premium capture over 91 trades in May and June
Continue reading "Options - How To Capture Over 100% Premium"

Precious Metals: Where Do They Go From Here?

When I see such situations in the market as we witnessed in precious metals lately, I think about two trading mantras. The first one says, “any profit is a profit,” aka “lose chances, not money,” and the second is “corrections are tricky.”

Both metals’ charts started to play out precisely as per the structure that was shown in my previous update, and I am very grateful as you supported my view with an overwhelming majority of voters. Indeed, it paid well, although the depth of the first leg down was just devastating as it exceeded the preset range.

Usually, the first legs are so strong and sudden as they trigger panic in the market. Although I expected this move weeks ahead, when it plays out, you’re never emotionally ready for such a storm as it literally could have no boundaries. The fear had it all. Some traders think they could sit through such enormous volatility. I doubt that risk management/capital/margin could allow it as gold lost more than 10% from the top to the bottom of the first leg while silver has been smashed, losing 22%.

The dust is quietly settling down after that fall, and we can adjust the plan. Let’s start with gold’s daily chart.

Precious Metals
Chart courtesy of tradingview.com

Again and again, we witness the real power of the trends as the “falling knife” of the first leg down was successfully rejected with the downside of the trend channel (gray). The price bounced off so hard that it retraced more than 60 percent of the preceding drop. Then it lost more than 60 percent again, but of the rise. If it continues to make such seesaw moves within a contracting range, then we will see a Triangle pattern shaping on the chart. I highlighted that option with a green color. I put two converging trendlines with almost ideal angles of a triangle, but the real path could differ, although the model should remain intact. The break above the last peak will trigger the upside move. Continue reading "Precious Metals: Where Do They Go From Here?"