Pendulum Swing No.5: Back To Success!

It’s time to announce the result of the 5th Pendulum swing pushed this January. In that race, I put heating oil (ultimate futures winner in the second half of 2017) vs. wheat futures (the top loser). The Pendulum effect favored the top loser, i.e., wheat to beat heating oil in the six month period. The image below contains the poll results of your voting for that experiment.

Image 1. Poll results

CBOE Volatility Index (VIX)
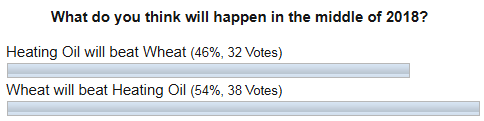
Chart courtesy of INO.com

Bingo! The majority of you guessed right choosing wheat as a winner and as you can see in the next chart that wheat has gained +17.56% as heating oil gained only +6.76. I would like to express my gratitude to those who chose the experiment success option for your trust! So after the first failure in the second half of 2017 (4th swing), the Pendulum experiment is back on a winning track! Let’s try it again and see what happens.

Chart 1. Half Year Futures Performance (First Half of 2018)

CBOE Volatility Index (VIX)
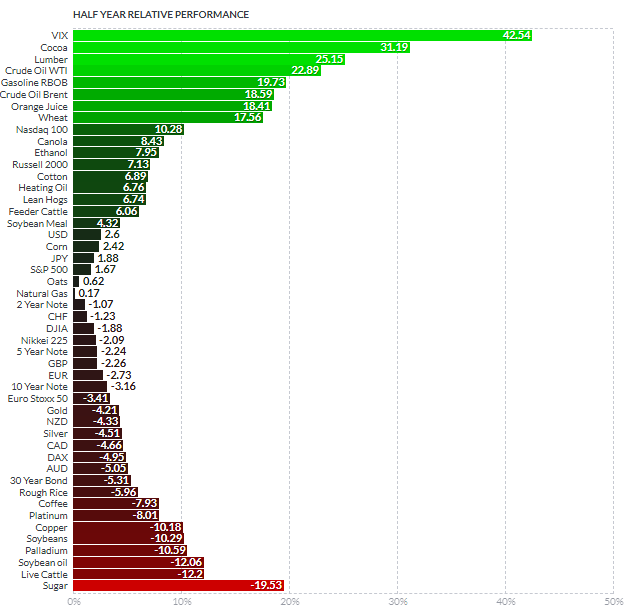
Chart courtesy of finviz.com

This time we will have an interesting race as the winner in the first half of 2018 is not a commodity, but the CBOE Volatility Index (VIX) also known as the stock market fear gauge. It gained more than 40%, leaving its rivals far behind amid the roller-coaster ride in the S&P 500.

On the other side, which is red, there is the biggest loser, sugar with an almost 20% loss in the first half of 2018. The supply glut in the sugar market undermined the price for this commodity significantly. Continue reading "Pendulum Swing No.5: Back To Success!"

Oil and Gas ETFs Are Having a Good 2018

Thus far in 2018, the oil and gas industry has been booming. Rig counts in the US are up, prices at the pump are up, and the oil and gas ETFs tracking the sector are up by a lot.

Investors who have been following the industry over the past year could have made some serious money as a few of the leveraged ETFs are up 238% or more. The Velocity Shares 3X Long Crude Oil ETN (UWT) is up 247% over the last 12 months and is up more than 70% year-to-date. The UBS ETRACS ProShares Daily 3X Long Crude ETN (WTIU) has risen 240% over the last year and 64% year-to-date. Finally, the Proshares UltraPro 3X Crude Oil ETF (OILU) is up 238% over the last 12 months and 63% year-to-date.

But, perhaps your less risky and don’t like investing in the leveraged ETFs? Well, you still could have done well as the United States Brent Oil Fund LP (BNO) is up 71% over the last year and 19.9% since the start of 2018. Or perhaps you went with the ProShares K-1 Free Crude Oil Strategy ETF (OILK) which is up 62% in the past 12 months and 23% year-to-date. Or either the iPath Series B S&P GSCI Crude Oil ETN (OILB) or the United States Oil Fund LP (USO) which are both up more than 61% over the last year and 23% year-to-date.

There have been some reasons why the industry has been on a tear over the last, and many of that reason don’t show signs of changing in the short term. OPEC is committed to increasing the price of oil (despite its recent modest increase in production), smaller US outfits still need slightly higher prices before they can add additional rigs and become profitable, the economy appears to be healthy and growing, US consumers have not yet begun to fell the “pain at the pump” again really. Continue reading "Oil and Gas ETFs Are Having a Good 2018"

Weekly Futures Recap With Mike Seery

We've asked Michael Seery of SEERYFUTURES.COM to give our INO readers a weekly recap of the Futures market. He has been Senior Analyst for close to 15 years and has extensive knowledge of all of the commodity and option markets.

Michael frequently appears on multiple business networks including Bloomberg news, Fox Business, CNBC Worldwide, CNN Business, and Bloomberg TV. He is also a guest on First Business, which is a national and internationally syndicated business show.

Crude Oil Futures

Crude oil futures in the August contract settled last Friday in New York at 68.58 a barrel while currently trading at 74.11 up about $5.50 for the trading week up for the 4th consecutive session hitting a 4-year high as this is the only commodity that is experiencing a bullish trend. The next significant level of resistance is around the $80 area as I think there could be a price squeeze in the front month due to the fact that the Trump administration has stated that they will put strict tariffs on any country that buys Iranian oil coupled with the fact that OPEC only increased production by 600,000 barrels as the fundamental picture for this commodity remains very strong in my opinion. Traders reacted very positively off of the API report which was released Wednesday as we had a drawdown of about 9 million barrels as there is robust demand for oil and gasoline as we are consuming record amounts as we head into 4th of July holiday weekend with a record amount people on the roads. Oil prices are trading far above their 20 and 100-day moving average as the trend is higher and if you're extended a futures contract continue to stay long and if you are not participating wait for some price, therefore, lowering the monetary risk to enter into a bullish position. The chart structure is terrible at the current time due to the fact of the exponential run-up in prices that we have experienced over the last several days.
TREND: HIGHER
CHART STRUCTURE: POOR
VOLATILITY: HIGH

Continue reading "Weekly Futures Recap With Mike Seery"

Oil Price Implications Of OPEC's New Oil Deal

OPEC concluded its meeting on June 22nd with a vaguely-worded communique about its oil deal:

“Accordingly, the Conference hereby decided that countries will strive to adhere to the overall conformity level of OPEC-12, down to 100%, as of 1 July 2018 for the remaining duration of the above-mentioned resolution and for the JMMC to monitor and report back to the President of the Conference.”

At the press conference afterward, OPEC president HE Suhail Mohamed Al Mazrouei, UAE Minister of Energy and Industry, struggled to explain exactly what it meant. When asked how many barrels would be added, he remarked that “you can do the math” between current output and the 100 percent conformity level, although he later said it was about one million barrels per day.

However, at the press conference of the 4th OPEC and non-OPEC Ministerial Meeting on June 23rd, oil ministers Khalid al-Falih of Saudi Arabia and Alexander Novak of Russia, responded to questions, explaining the new deal and how it would be implemented.

But Iran’s oil minister later said that OPEC’s oil output agreement did not specify a production increase, which probably explains why the agreement was left vague. It also explains Mr. Al-Falih’s unusual remark at the press conference: Continue reading "Oil Price Implications Of OPEC's New Oil Deal"