Pendulum Swing No.6: Input Error

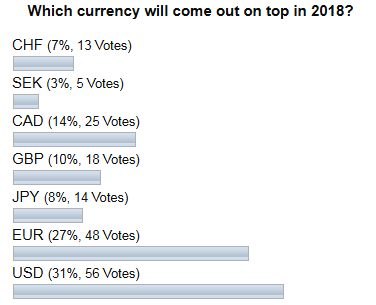
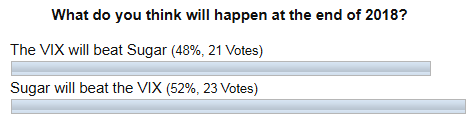
Another half of a year passed with a new year starting its track. It is time to see the result of the 6th Pendulum swing started in the middle of 2018. To remind you, we had pitted the VIX against sugar and below are your bets for that experiment.

Pendulum

You are the best readers I could only dream of as you support my experiment with your real votes for the success of it.

Let’s see which instrument won at the end of the year.

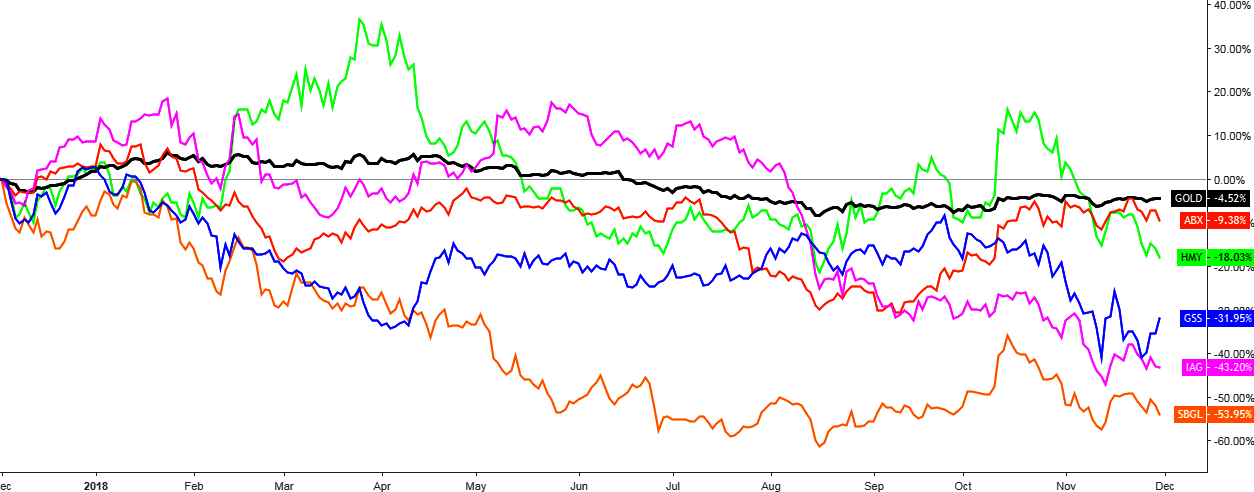
Chart 1. Half Year Futures Performance (Second Half Of 2018)

Pendulum
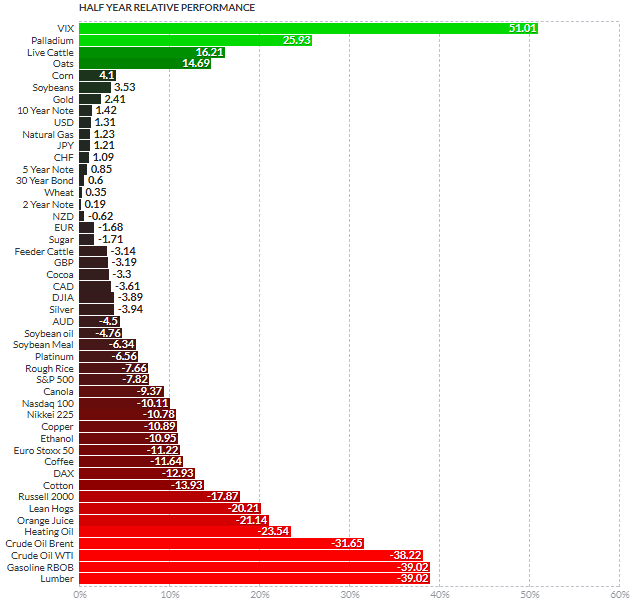
Chart courtesy of finviz.com

As we can see from this half-year, performance chart sugar couldn’t beat the VIX, which dominated the futures market by a huge margin throughout 2018. One can think that the experiment failed this time, but in my opinion, we have the wrong selection of one input. I am talking about the VIX. The thing is that the underlying asset of these futures is not a commodity, but the “Fear index” or the indicator of the risk approach. Continue reading "Pendulum Swing No.6: Input Error"

Fiat Majors Vs. Gold In 2018

It’s time for my traditional yearly post about the dynamics of “modern” money (fiat) compared to the “old” or “perpetual” money (gold) in the current year.

Fiat money is represented by 7 currencies: US Dollar (USD) and 6 components of the US Dollar Index (DXY) placed by weight: Euro (EUR), Japanese Yen (JPY), British Pound (GBP), Canadian Dollar (CAD), Swedish kKrona (SEK) and the Swiss Franc (CHF).

Before we get down to the results of 2018, let us see how did you see the future back at the end of December 2017.

fiat

The most of you bet that the king currency (USD) would beat all the rest in 2018. Your second favorite is the single currency (EUR), which is the top rival of USD.

There could be at least two reasons for this ballot result a year ago. The first one is more obvious and is coming from the country distribution of the INO.com web traffic as more than half of it comes from the United States. The other reason is also logical as the US Dollar was the top loser last year with -10% and you could bet on it using the knowledge about the “Pendulum effect”, which pushes laggards to the top.

Now let’s move on to the results of 2018. Continue reading "Fiat Majors Vs. Gold In 2018"

Gold & Silver: US Dollar Could Spoil Santa Claus Rally

Here we are on the final track of the year, and investors hope for the traditional Santa Claus rally in the precious metals sector. This euphoria of the anticipated strength based on the current move up could be spoiled if this pattern would emerge in the US dollar index (DXY).

Chart 1. US Dollar Index Daily: Triangle

US Dollar
Chart courtesy of tradingview.com

The disappointing data of US non-farm payrolls released last Friday couldn’t damage the US dollar as it kept above the former trough established on the 4th of December at 96.30. The first reaction in the market was a USD sell-off against all major currencies, but it was short-lived, and none of the former extremes were breached. This made me focus on the Dollar Index chart to see if there is some pattern or trading setup has been shaping amid this unusual market behavior. Continue reading "Gold & Silver: US Dollar Could Spoil Santa Claus Rally"

Gold Stocks Couldn't Beat Gold

One year ago I shared with you the similar dynamics of the top gold stocks ranked by ROE. There were five tickers: ABX (Barrick Gold), SBGL (Sibanye Gold), IAG (IAMGOLD), GSS (Golden Star) and HMY (Harmony Gold Mining). I want to update on their price dynamics to show you which of your bets played out after one year.

Before we get down to the results, below is the distribution of votes for each stock for you to recall those bets.

gold stocks

For the second time in a row, the majority of you bet on Barrick Gold (ABX) despite that this company was among the top losers a year ago. Another interesting fact is that the Golden Star (GSS) was the least favorite, although it had shown the best result last time. This is what we call mysterious investors’ sentiment.

Chart 1. Gold Stocks Vs. Gold: Unmatched

gold stocks
Chart courtesy of tradingview.com
Continue reading "Gold Stocks Couldn't Beat Gold"

Gold Extends Consolidation Giving Silver Another Chance

Gold and silver exchange leading roles in the market quite often, especially on the short-term charts. Last time I wrote about it silver saved gold from collapse at the start of this month. The white metal unexpectedly bounced off the earlier low reversing the drop of the yellow metal.

This time gold took the lead as its failure to break below the Bear Flag let silver lick its wounds and return above the $14 handle.

Both metals are still trapped in the middle of the range set by the earlier heavy drop, which first occurred in gold and then it was repeated in the silver market. In this post, I have focused on the local structure as the bigger picture remains unchanged.

Chart 1. Gold Daily: 3rd Leg Up Is Uncommon But Possible

consolidation
Chart courtesy of tradingview.com

The top metal couldn’t break below the trendline support of a Bear Flag (orange) and then quickly restored most of its losses coming back above $1200. It is interesting that the forecasted drop unfolded quite differently in each metal. Silver tagged the earlier trough, but gold failed even to breach the vertically sloped trendline. It looks like strong demand appeared right at the round number of the gold price in the $1200 area. Continue reading "Gold Extends Consolidation Giving Silver Another Chance"