The S&P 500 Has Two Options

Aibek Burabayev - INO.com Contributor - Metals - S&P 500


Back in February, I shared a map for the possible development of a consolidation that started at the end of January in the S&P 500 index. The expected drop followed the post although a little bit postponed.

As top metals are literally dead and still between the confirmation levels these days, I would like to update a lively S&P 500 index chart. For the gauge of American stock market, I prepared two separate charts as it has reached the crucial support and we could have two future options here.

Chart 1. S&P 500 Weekly: Make It Or Break It

S&P 500
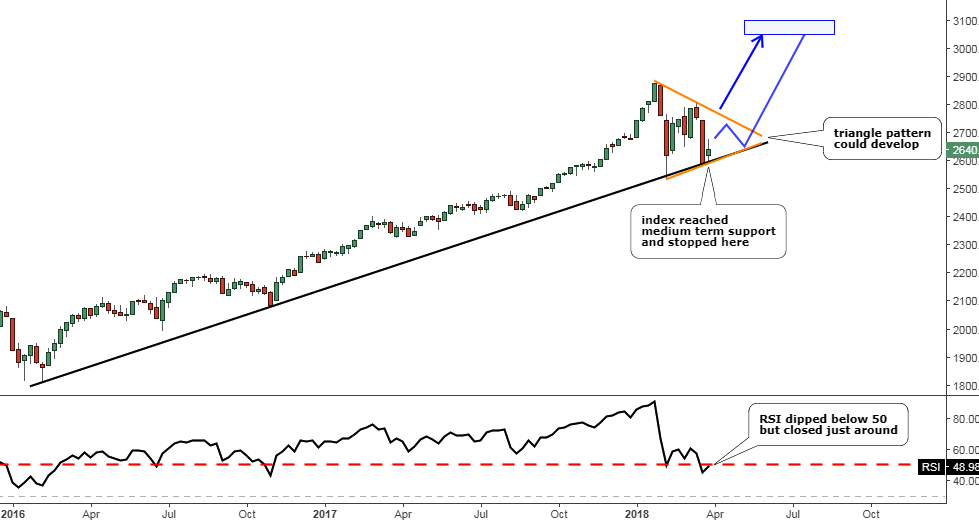
Chart courtesy of tradingview.com

In the monthly chart from my earlier post I added the orange, medium-term support, which I highlighted in black in the weekly chart above. As we can see, that support already stopped the previous drop in February and did it again at the end of March. If the price would freeze at these levels without breaking below the former trough, then the Triangle pattern (orange) could develop as lower highs and higher lows shape it. Continue reading "The S&P 500 Has Two Options"

Why Rebalancing Your Portfolio Is Important

Matt Thalman - INO.com Contributor - ETFs - Rebalancing


Despite only being three months into 2018, investors have been on quite a wild ride. The market started off the year as it ended 2017, on a tear higher, then the brief crash in early February, which led to a nice calm recovery during the remainder of the month just to run into what I’m calling “Whipsaw March” with the market jumping higher and lower by more than 1% nearly every other day. Not only have the major indexes been extremely volatile, but some of 2017’s biggest winners, big technology and especially the FANG stocks have seen their prices fall more than 10% in 2018.

Big pops that reverse fortune and the big drops that follow always cause investors to wonder what they could have done to protect themselves from the decline without completely abandoning their position.

The most straightforward and most effective answer to that situation is to rebalance your portfolio. Rebalancing is when you bring the percentage of your holdings back in line with each other.

For example, if you have a portfolio made up of 10 stocks and each represents roughly 10% of your portfolio, you would have a ‘balanced portfolio.’ Now if one of your stocks outperformed the others and ended up representing say 25% of your portfolio, instead of just 10%, then you would rebalance by selling some of your shares in that company until it represented 10% of your total portfolio. Continue reading "Why Rebalancing Your Portfolio Is Important"

The Powell Era Begins

George Yacik - INO.com Contributor - Fed & Interest Rates - Powell


New Federal Reserve chair Jerome Powell had all kinds of excuses not to raise interest rates at last week’s FOMC meeting:

  • The yield on the 10-year Treasury note was trading close to its highest point in more than four years and dangerously close to breaking the 3% barrier.
  • Stocks have fallen well off their highs, and investors are nervous about the prospects of a potential trade war between the U.S. and its biggest trading partners, particularly China and Canada.
  • The threat of that trade war has influenced some economic forecasters to lower their GDP growth forecasts for the first quarter to below 2%, which would be the lowest level since President Trump took office.
  • The turmoil in the Trump Administration, with cabinet secretaries and other senior officials jumping ship or being pushed overboard, doesn’t help calm the waters.

Yet Powell and the seven other voting members of the Federal Open Market Committee saw fit to raise the federal funds rate by a quarter percentage point to a range between 1.5% and 1.75%. Not only that, but the FOMC stuck to its guns and indicated a steady diet of rate increases over the next three years, pushing rates closer and closer back to what used to be normal before the global financial crisis. After three rate increases this year, three more are likely next year followed by two more in 2020, which would boost the fed funds rates to a range of 3.25% and 3.5%.

And yet the world didn’t end. In fact, the yields on Treasury securities actually fell after the meeting ended on Wednesday afternoon. The 10-year note, the bond market’s long-term benchmark, trading just below 2.90% on Tuesday, fell five basis points after the meeting to 2.85%. The yield on the two-year note, which is more sensitive to interest rate changes, dropped seven bps after the meeting. Continue reading "The Powell Era Begins"

IBM - Blockchain Technology Driving Growth

Noah Kiedrowski - INO.com Contributor - Biotech - Blockchain


“What the internet did for communications, blockchain will do for trusted transactions.”
— Ginni Rometty, IBM Chief Executive Officer

Introduction

International Business Machines Corporation (IBM) has struggled in recent years to transition away from its dependency on legacy businesses to the future of cloud, artificial intelligence, and analytics. Despite this long transition of posting 20+ consecutive quarters of declining revenue, IBM has finally posted its first revenue growth in nearly six years. Its long-term imperatives are beginning to bear fruit in emerging high-value segments that has fundamentally changed its business mix while evolving its offerings to align with new age information technology demands. New talent has driven these long-term business initiatives in these key areas as ~50% of its employee base has been added to the company within the last five years. A new frontier of growth lies in the nascent blockchain technology as IBM is a first mover in this promising, emerging technology. As IBM transitions to quarterly revenue growth, per the recent guidance of low single-digit growth, in the backdrop of its evolution to emerging high-value segments (i.e., blockchain) the company presents a compelling investment opportunity. In addition to the evolving business mix, IBM offers a great dividend, share buyback program while continuously acquiring companies to drive the business into the future.

Blockchain Technology and Applications

Blockchain technology is the architecture that underpins the volatile cryptocurrency markets. This technology applies to enterprise applications since it employs a decentralized database, open ledger, and incorruptible transactional capabilities. Blockchain applies to any transactional business model whether it’s financial or goods being transacted. The open ledger concept within the blockchain makes it incorruptible as any changes need confirmation from multiple parties and any changes can be seen at any time with a permission blockchain. As a function of the decentralization, there’s no central repository or clearinghouse to be hacked or accessed. The blockchain speeds up and by-passes these intermediaries (i.e., a clearinghouse of the bank) to achieve transactions within minutes and not days (Figures 1 and 2). Continue reading "IBM - Blockchain Technology Driving Growth"

Updated 2018 Crude Oil Outlook

Robert Boslego - INO.com Contributor - Energies - Crude Oil Outlook


Analysis prepared on March 19, 2018

The relative rate of growth in supply v. demand will ultimately determine stock levels and prices. And the three key predicting agencies, the International Energy Agency (IEA), Energy Information Administration (EIA), and OPEC have different views on what is likely to unfold.

OPEC does not often predict is own production, but in December it forecast it would average 33.2 million barrels per day (mmbd) during 2018. That would far exceed its projected “call on OPEC oil,” which is world demand minus non-OPEC production. For 2018 as a whole, it predicts that figure will be 33.1 mmbd.

That demand for OPEC oil is based on a gain in demand of 1.52 mmbd and a rise in no-OPEC production of 1.15 mmbd. In my view demand is likely to be a bit stronger due to world economic growth. However, the non-OPEC supply number is much too low, given the recent rise in U.S. production of 886,000 b/d from August through November. (December production was down a bit for seasonal reasons.) Furthermore, U.S. production has yet to respond to $60/b. The rise in output last autumn was a response to $50/b.

The EIA has the most aggressive non-OPEC production estimate of a gain of 2.5 mmbd, with 2.0 occurring in the U.S. alone, and the balance in Canada and Brazil. The EIA forecast is based on a gain in crude production of 1.5 mmbd and a rise in other liquids of 500,000 b/d. WTI did not exceed $60 in any month since 2015 until January 2018. And the year-over-year gain in March 2018 is estimated to be 1.29 mmbd. And so the industry’s response to $60/b could very well enable the 1.5 mmbd gain. Continue reading "Updated 2018 Crude Oil Outlook"