Options Based Resiliency - September Outperformance

Options trading, at its core, is defining risk, leveraging a minimal amount of capital, and maximizing return on investment. Options trading in combination with long equity via broad-based index ETFs and cash-on-hand provides portfolio agility in the face of market corrections and in times of volatility expansion. COVID-19 was the linchpin for the major indices to drop over ~30% in March. Logging the worst sell-off since the Great Depression and inducing extreme market volatility that hasn’t been since the Financial Crisis.

Although options trading provides a margin of downside protection and a statistical edge, no portfolio is immune from the wreckage when hit with a black swan event. Thus proper portfolio construction is essential when engaging in options trading to drive portfolio results. One of the main pillars of building an options-based portfolio is maintaining ample liquidity by holding ~50% of one’s portfolio in cash. This liquidity position provides portfolio agility to adjust when faced with extreme market conditions such as COVID-19 and the September market correction rapidly.

An agile options based portfolio is essential to navigating these pockets of volatility. The COVID-19 induced sell-off and recent September correction are prime examples of why maintaining liquidity is one of the many keys to an effective long term options strategy. In May, June, July, August, and September, 121 trades were placed and closed. Options win rate of 98% was achieved with an average ROI per trade of 7.3% and an overall option premium capture of 90% while outperforming the broader market over the September downturn (Figure 1).

Options

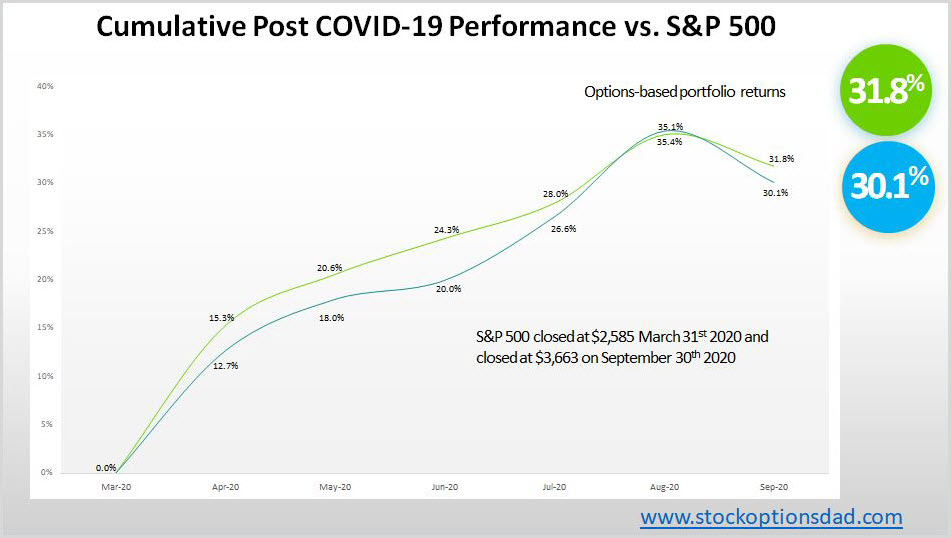
Figure 1 – Smooth and consistent portfolio appreciation while matching the broader market gains and outperforming during the market sell-off in September. An overlay of an options/cash/long equity hybrid portfolio and the S&P 500 post-COVID-19. Even under the most bullish conditions, the hybrid portfolio outperformed the index with ~50% in cash
Continue reading "Options Based Resiliency - September Outperformance"

Crude Oil Outlook Is Highly Uncertain

The Energy Information Administration reported that July crude oil production rebounded by 538,000 barrels per day, averaging 10.984 mmbd. This follows a 427,000 b/d rise in June and a 2 million barrel per day collapse in May. The July 914 figure compares to the EIA’s weekly estimates (interpolated) of 11.045 mmbd, a figure that was 61,000 b/d higher.

Crude Oil

Rebounds were largest in North Dakota (157,000 b/d), Texas (103,000), Gulf of Mexico (85,000), Alaska (83,000) and New Mexico (42,000). Given the huge reduction in May, production dropped by 864,000 b/d over the past 12 months. This number only includes crude oil. Other supplies (liquids) that are part of the petroleum supply rose by 70,000 b/d from a year ago. Continue reading "Crude Oil Outlook Is Highly Uncertain"

Will Gold Outshine Silver?

The collective mind of the Blog's readers has proved to be very powerful as the majority of you guessed it right last time, that the U.S. dollar index (DXY) will reverse down. My assumption that precious metals will start to grow also played out accurately so far, and one could get the clue of DXY reversal from the assumption mentioned above.

In this update, I added minor annotations for fine-tuning previous charts as I switched to a lower time frame of 4-hour. The final chart below will show you the background for the title of this post. Let us start with the DXY 4-hour chart.

Dollar Index

The market indeed saw that orange trendline resistance as the price reversed right at that point. The RSI turned bearish now as it broke below the crucial level of 50. The indicator raises its head together with the price, which could throwback to retest the resistance. The former could briefly overthrow the crucial level, and then it should drop below it again to confirm the Dollar's further weakness. Continue reading "Will Gold Outshine Silver?"

Extreme Volatility Hits Natural Gas Futures

Natural Gas Futures

Natural gas futures in the November contract settled last Friday in New York at 2.80 while currently trading at 2.43, down about 37 points for the week, hitting a 2 month low.

I am not involved as the volatility is extremely high. That situation isn't going to change as we enter the winter months as seasonably speaking, you can have tremendous price swings daily. I will be looking at a counter-trend trade soon. I think the contract low, which was hit on June 25th at 2.13, will keep a close eye on this market as I think a bottoming situation is starting to occur.

Gas prices are trading under their 20 and 100-day moving average as the trend is mixed to lower in my opinion as prices topped out right around the 3.00 level just several weeks ago. Fundamentally speaking, industrial natural gas demand remains tepid as BNEF data shows gas demand from power generators was estimated at just under 30 bcf for last Monday, which is the lowest for any September 21st since 2015.

TREND: LOWER - MIXED
CHART STRUCTURE: POOR
VOLATILITY: HIGH

Orange Juice Futures

Orange juice futures in the November contract is currently trading at 111.85, ending the week on a sour note after settling last Friday in New York at 105.75, up over 600 points for the week bottoming out around the 105 level. Continue reading "Extreme Volatility Hits Natural Gas Futures"

Chop & Grind: Gold, Stocks And Commodities

Whether the market is foreign or domestic, equity, commodity, or metal the grind is on. Speaking of grind, the one in gold has been expected as the metal builds out its big picture Handle to the bullish Cup with an objective that is much higher. Let’s take a look at a few NFTRH charts to gauge the grind in several markets and by extension, the grind many feel on their nerves these days. It’s not a time to make money. It’s a time to preserve gains and patiently position.

For gold, the grind would be the making of a Handle after the Cup’s key higher high to the 2011 high.

gold price

The daily chart below shows the form it is taking; a falling wedge toward the first support area just above 1800. If the monthly chart above is to make a substantial Handle the gold price correction could extend to a test of the rising 200-day average. RSI and MACD are negative.

Easy now, it’s not a prediction, but don’t let the perma-pompoms tell you it is not doable. Let’s keep it muted ladies. Continue reading "Chop & Grind: Gold, Stocks And Commodities"