Today when I saw that precious metals started to rise after a correction I detected on the charts my favorite pattern called the Bull Flag. This pattern can change the targets depicted in my earlier gold and silver posts, better say enrich them.
Chart 1. Gold Daily: Beyond 1300!
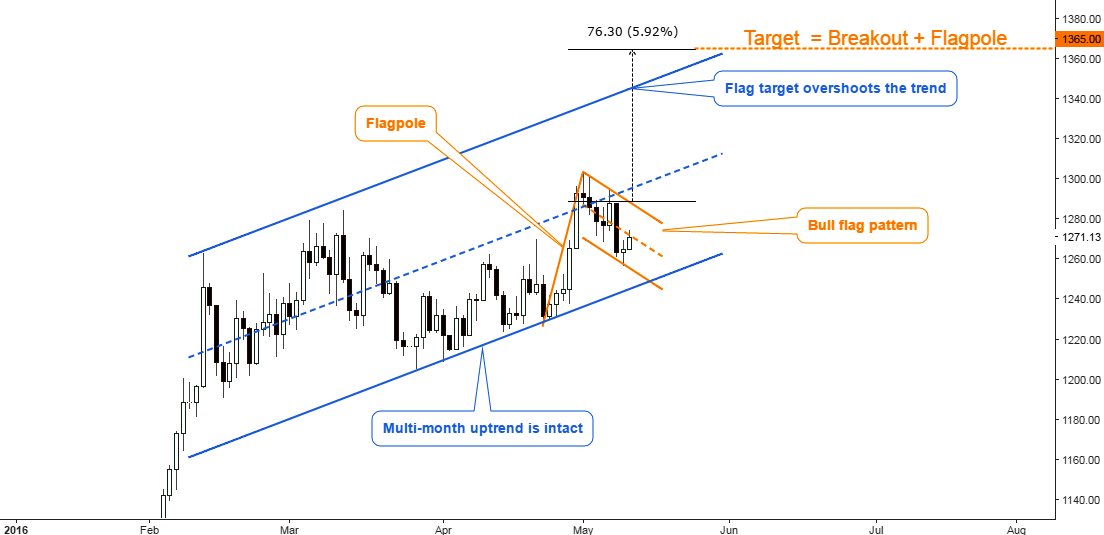
Chart courtesy of tradingview.com
Gold is in the blue multi-month uptrend. The angle is not as sharp as it was at the start of the year, but it still can take gold to fresh highs. Continue reading "Gold & Silver Daily: Ladies And Gentlemen, The Bull Flag!"
 What do you think would be the "perfect caption" for this photograph of Senator Bernie Sanders?