Gold Failed And Silver Is On The Edge

Aibek Burabayev - INO.com Contributor - Metals- gold silver prices


As promised in my earlier post I updated the silver chart for you in this post as I spotted some exciting patterns forming on the chart below. But first, I would like to start with the stronger of the two metals, gold.

Chart 1. Gold Daily: Couldn’t Tag Previous Top

gold silver prices
Chart courtesy of tradingview.com

Indeed, it was another excellent try when the bulls attempted to break loose from this long-lasting range established between $1046 and $1375 in 2016. But the RSI indicator didn’t agree as lower tops showed a hidden Bearish Divergence and this spoiled this nice bullish attack. The $1375 resistance has been left untouched. Moreover, now this strong indicator indicates that the bears took the ball as it dipped below the crucial 50 level. Continue reading "Gold Failed And Silver Is On The Edge"

Weekly Futures Recap With Mike Seery

We've asked Michael Seery of SEERYFUTURES.COM to give our INO readers a weekly recap of the Futures market. He has been Senior Analyst for close to 15 years and has extensive knowledge of all of the commodity and option markets.

Michael frequently appears on multiple business networks including Bloomberg news, Fox Business, CNBC Worldwide, CNN Business, and Bloomberg TV. He is also a guest on First Business, which is a national and internationally syndicated business show.

Gold Futures

Gold prices in the April contract are currently trading at 1,319 an ounce after settling last Friday in New York at 1,319 as the U.S. stock market dropped 10% in a matter of days. Generally speaking, that sends gold prices much higher, but not in this case as the precious metals continue to go lower. The U.S. dollar is the main culprit to this phenomenon as its higher once again today as investors are buying the dollar and selling all assets including the metals as silver and platinum continue to move lower coupled with the fact that copper has absolutely fallen out of bed this week. If you take a look at the daily chart gold prices bottomed out on December 12th at 1,242 while then topping out on January 25th at 1,370 and the 50% retracement stands around the 1,306 area. I think that will be tested in next week's trade as I am currently not involved in any of the precious metals. Gold is trading below their 20-day moving average, but slightly above its 100-day as we are right near a five-week low as investors don't want to own anything at the current time. It looks to me this could continue next week as well. However, there is panic going on at present as there will be very good buying opportunities in the coming days ahead.
TREND: MIXED - LOWER
CHART STRUCTURE: POOR
VOLATILITY: INCREASING

Continue reading "Weekly Futures Recap With Mike Seery"

A Few Marijuana ETFs For U.S. Investors

The marijuana industry is taking North America by storm, well maybe that happened back in the ’60s, but now the legal marijuana industry is doing it today. Despite the fact that the U.S. Federal Government still considers marijuana a Schedule I substance and therefore illegal, it appears the “pot” movement is taking hold as 29 U.S. States have already legalized the use of medical marijuana and another eight have legalized marijuana for recreational use.

This movement has drawn the attention of everyday investors and those on Wall Street. Over the past few years, we have seen an explosion of small, risky, marijuana investments pop up. The sheer number of options has been overwhelming and very risky for average investors to get involved with, but that is all changing very quickly.

In the spring of 2017 the first marijuana ETF, Horizons Marijuana Life Sciences Index ETF (HMMJ), debuted. This was investors first chance to buy into the industry without taking on ‘single-stock’ risk in a very fragmented and risky industry.

The big issue though with HMMJ is that it is a Canadian ETF and thus it trades on the Toronto Stock exchange. That means for U.S. based investors it was either difficult, as in their online broker wouldn’t allow them to buy the investment, or very expensive, as in $60 per transaction (that is $60 trading commission to buy and $60 to sell it). Continue reading "A Few Marijuana ETFs For U.S. Investors"

Stocks Dive As Volatility Spikes

Hello traders everywhere. Volatility is indeed the theme of the week, and you have to wonder if this is the new normal for the foreseeable future. The DOW opened over 300 pts higher only to reverse course to head as much 460 pts or 1.9% lower on the day as we head into the close where the big moves have come in the last hour of trading. The DOW will issue a new red monthly Trade Triangle if it breaks through the 26,616.71 and that would indicate it’s heading lower.

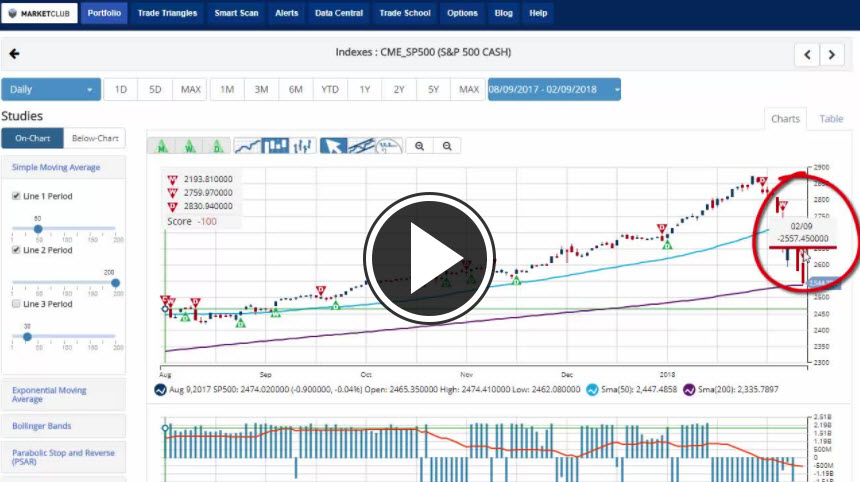
Both the S&P 500 and NASDAQ have both issued new red monthly Trade Triangles indicating that they have both entered into a short trading territory. In fact, the S&P 500 is very close to breaking through its support at the 200-day MA at 2539.03. If that’s broken, we could see the market head lower. However, we’ve seen the S&P 500 pass through the 200-day twice in recent memory only to head back higher. Will it be different this time?

Volatility

Crude oil is trading below $59 a barrel for the first time in 2018. This move lower has been about the growing U.S. inventory, an ever-increasing rig count, and a rising U.S. Dollar. It was reported today by Baker Hughes that 26 rigs were added this week bringing the total count to 791 active rigs. That’s 200 more active rigs than a year ago at the same time.

Bitcoin is up on the day and trading slightly above its 200-day MA which has given the cryptocurrency a level of support at the $7,958.53. Bitcoin seems to have calmed down and moved into a sidelines mode as we end the week.

Key Levels To Watch This Week:

S&P 500 (CME:SP500): 2,872.87
Dow (INDEX:DJI): 26,616.71
NASDAQ (NASDAQ:COMP): 7,501.58
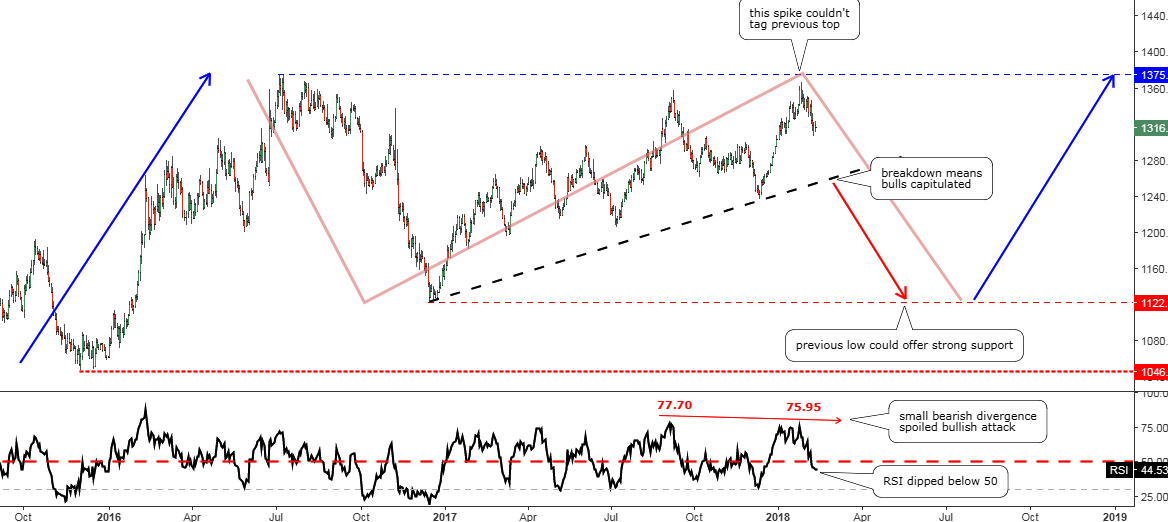
Gold (NYMEX:GC.G18.E): 1,334.80
Crude Oil (NYMEX:CL.H18.E): 64.18
U.S. Dollar (NYBOT:DX.H18.E): 90.50
Bitcoin (CME:BRTI): 11,705.00

Every Success,
Jeremy Lutz
INO.com and MarketClub.com

This Cannabis Landlord Is Trading At A Discount

Analysis originally distributed on January 31, 2018 By: Michael Vodicka of Cannabis Stock Trades

Arizona's cannabis industry was on fire in 2017 - setting a long list of new records. Today, I am going to show you how you can profit with a young and secretive cannabis company I like to call - the Cannabis Landlord.

2017 was a record year for Arizona's young cannabis industry.

According to an annual report from the Arizona Department of Health Services, in 2017 Arizona patients consumed more than 43 tons of cannabis products.

That is an eye-popping increase of 50% from 29 tons sold in 2016.

Take a look at the steady growth below.

LL

The strong 2017 builds on years of impressive industry growth.

Since medical cannabis was legalized in Arizona five years ago, 130 new dispensaries have popped up across the state, with cannabis sales jumping 1,620%.

As you can see, Nevada's cannabis industry is in a long-term bull market as more patients gains access to cannabis. Continue reading "This Cannabis Landlord Is Trading At A Discount"