The recent collapse of the top precious metals shouldn't be a surprise if you read my previous Gold & Silver update in November, where I called for the upcoming “storm” after the “calm.” In this post, I’ll share with you the updated charts of both metals.
I changed the order of the charts, and this time I would start with silver as it reached the first decision point ahead of gold.
Chart 1. Silver Daily: First Target Reached
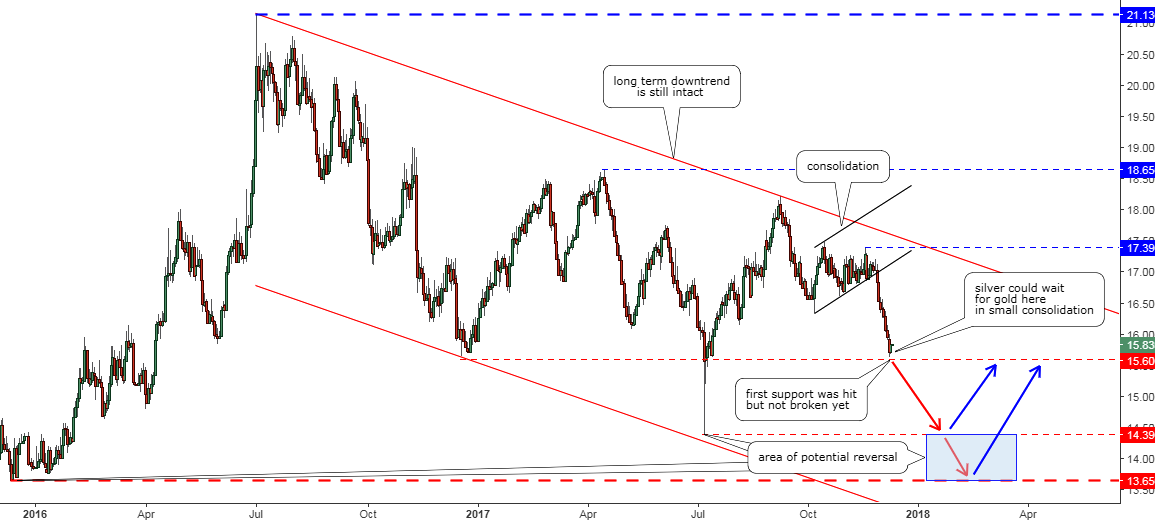
Chart courtesy of tradingview.com
Silver has a strong bearish structure as the red long-term trendline keeps the pressure on silver. The second leg of consolidation within the black parallel channel lacked power as the price couldn’t reach even the top of the first leg established in October at the $17.47 per oz. It stalled at the $17.39 per oz. and then collapsed for more than a half of a dollar to check the consolidation support. Continue reading "Gold & Silver: Silver Hits Support As Gold Cracks Consolidation"