In September I warned you about the possible weakness in both gold and silver after a good rally as strong reverse signals appeared on the chart. That warning alert paid well as the metals dropped heavily – gold lost more than 7%, and silver fell more than 10%. I hope it helped those of you who had market exposure that time.
There are updated charts below with further price action forecast, which is based on pattern recognition and market staging approach. I hope my detailed graphs with annotations will help you understand market behavior, training your eyes to recognize patterns and determine market stages with me.
Chart 1. Gold Daily: The Baby Bird Could Fall Out Of The Nest
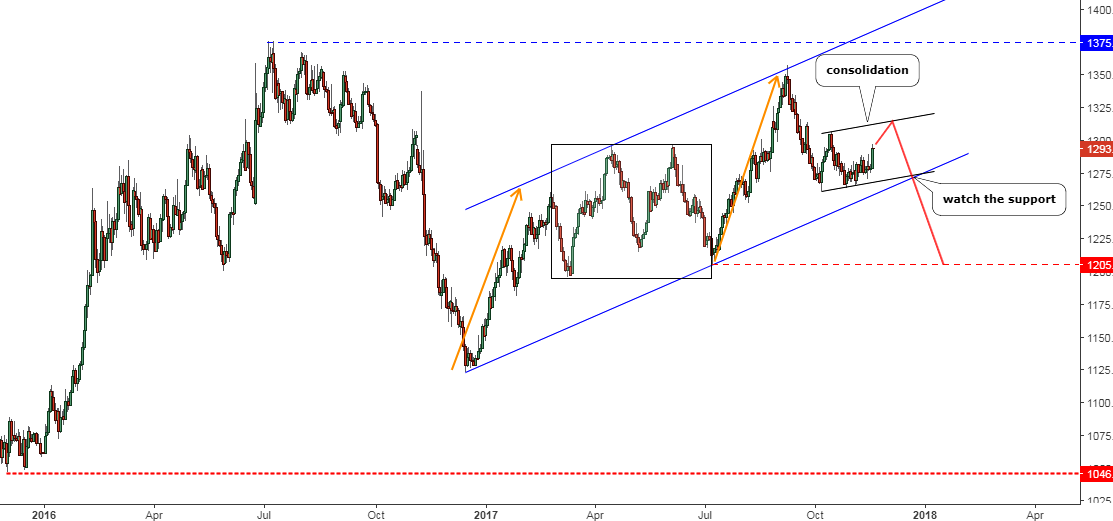
Chart courtesy of tradingview.com
In the previous gold chart I put two zigzags to show you possible paths for further price action, the red zigzag was the main option, it showed the downside move with a small consolidation inside. In reality, the drop has been even sharper with just a minor correction within. Continue reading "Gold & Silver: The Calm Before The Storm"